|
Income:
Median household income was $63,179 in 2018, not statistically
different from the 2017 median
The 2018 real median income of family households and nonfamily
households increased 1.2 percent and 2.4 percent, respectively,
between 2017 and 2018 This is the fourth consecutive annual increase
in median household income for family households.
The 2018 real median income of Asian households increased 4.6
percent from 2017 to $87,194, while the real median incomes of
non-Hispanic White ($70,642), Black ($41,361), and Hispanic
($51,450) households were not statistically different from their
2017 medians
For householders under the age of 65, real median household income
was not statistically different between 2017 and 2018, while real
median household income for householders aged 65 and over increased
3.3 percent from 2017
The real median income of households maintained by a native-born
person increased 1.4 percent between 2017 and 2018, while the 2018
real median income of households maintained by a foreign-born person
was not statistically different from 2017
Earnings:
Between 2017 and 2018, the real median earnings of all workers
increased 3.4 percent to $40,247
The 2018 real median earnings of men ($55,291) and women ($45,097) who worked
full-time, year-round increased by 3.4 percent and 3.3 percent, respectively,
between 2017 and 2018. The 2018 female-to-male earnings ratio was 0.816, not
statistically different from the 2017 ratio.
The number of full-time, year-round workers increased by 2.3
million, between 2017 and 2018. The number of men and women
full-time, year-round workers increased by about 700,000 and 1.6
million, respectively.
Poverty:
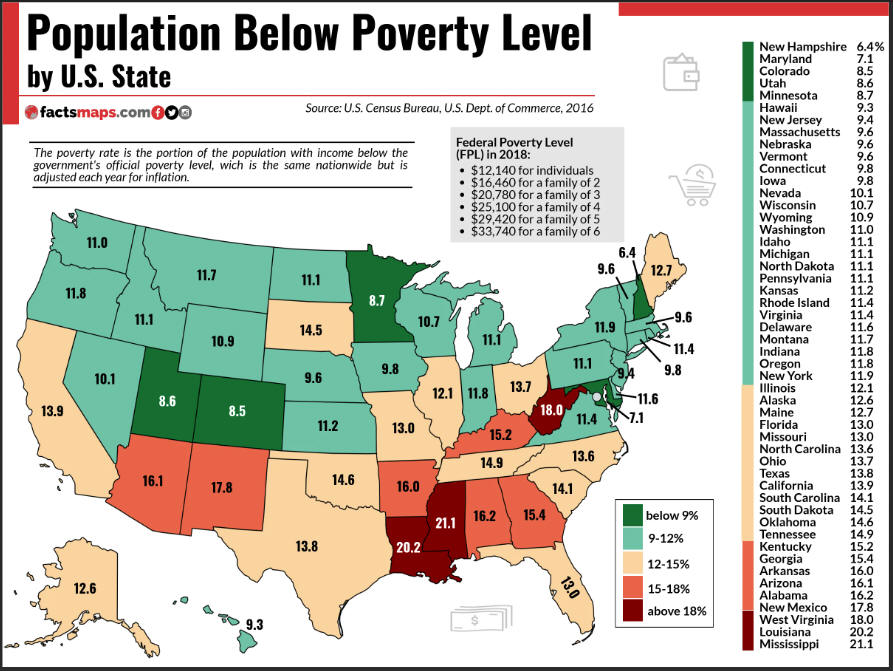
The official poverty rate in 2018 was 11.8 percent, down 0.5
percentage points from 12.3 percent in 2017. This is the fourth
consecutive annual decline in poverty. Since 2014, the poverty rate
has fallen 3.0 percentage points, from 14.8 percent to 11.8 percent.
In 2018, for the first time in 11 years, the official poverty rate was
significantly lower than 2007, the year before the most recent recession.
In 2018, there were 38.1 million people in poverty, approximately 1.4 million
fewer people than 2017.
Between 2017 and 2018, poverty rates for children under age 18
decreased 1.2 percentage points from 17.4 percent to 16.2 percent.
Poverty rates decreased 0.4 percentage points for adults aged 18 to
64, from 11.1 percent to 10.7 percent. The poverty rate for those
aged 65 and older (9.7 percent) was not statistically different from
2017.
From 2017 to 2018, the poverty rate decreased for non-Hispanic Whites;
females; native-born people; people living in the Northeast, Midwest, and
West; people living inside metropolitan statistical areas and principal
cities; people without a disability; those with some college education; people
in families; and people in female householder families.
Between 2017 and 2018, people aged 25 and older without a high school diploma
was the only examined group to experience an increase in their poverty rate.
Among this group, the poverty rate increased 1.4 percentage points, to 25.9
percent, but the number in poverty was not statistically different from 2017.
|