|
||||||||||||
|
|
|
Solar Cycle
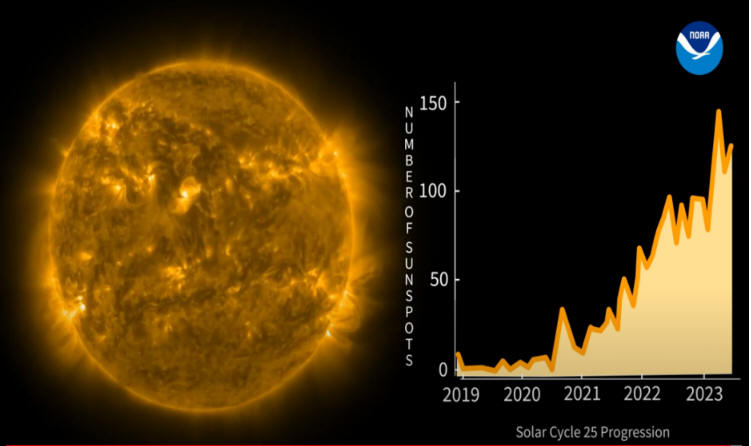
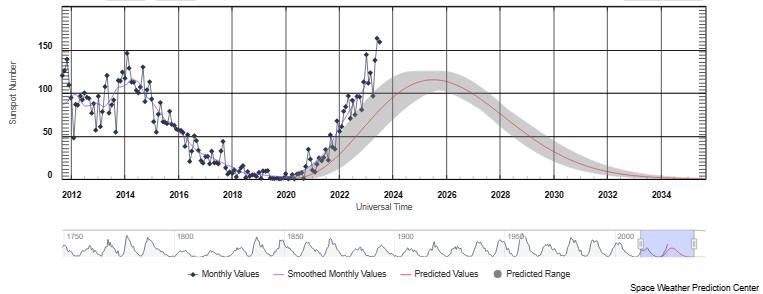
SOLAR CYCLE PROGRESSION
The Schwabe solar cycle or Schwabe-Wolf cycle is the eleven-year cycle of solar activity of the sun.
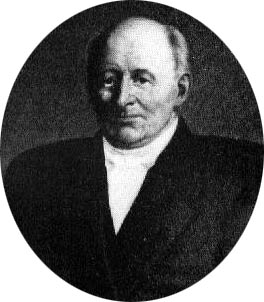
It was named after Samuel Heinrich Schwabe (October 25, 1789 April 11, 1875) a German astronomer remembered for his work on sunspots.
At periods of highest activity, known as solar maximum or solar max, sunspots appear. Periods of lowest activity are known as solar minimum.
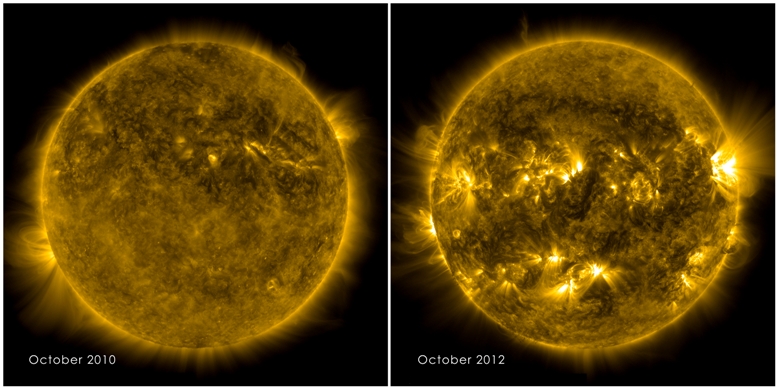
The picture on the left shows a calm sun from Oct. 2010. The right side, from Oct. 2012, shows a much more active and varied solar atmosphere as the sun moves closer to peak solar activity, a peak known as solar maximum, predicted for 2013. Both images were captured by NASA's Solar Dynamics Observatory (SDO) observing light emitted from the 1 million degree plasma, which is a good temperature for observing the quiet corona. Credit: NASA/SDO
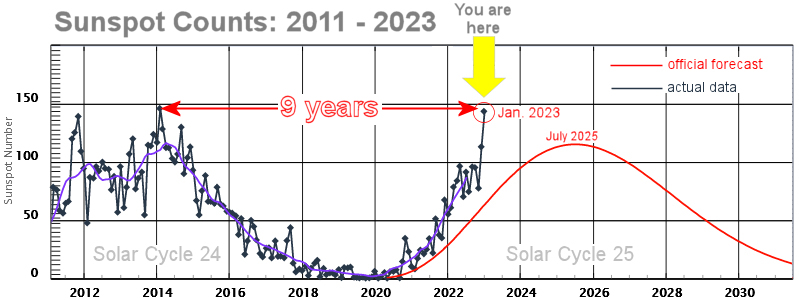
Three flares erupt from the Sun in this timelapse image from SDO’s AIA 193 channel. The first two flares, in the bottom right region, peak at 2021-11-01T18:01 UT and 2021-11-01T21:33 UT. The third flare, near the center of the image, peaks at 2021-11-02T03:01 UT. Credit: NASA/SDO The solar cycle is not strictly 11 years; it has been as short as 9 years and as long as 14 years in recent years.
ESA/NASA’s SOHO spacecraft captured three CMEs erupting from the Sun. The first two appear from the bottom right of the central disk at 2021/11/1 19:00 and 22:00; the third from around the disk at about 2021/11/2 03:00. Credit: ESA/NASA/SOHO
It is followed by a period of quiet called the "solar minimum".
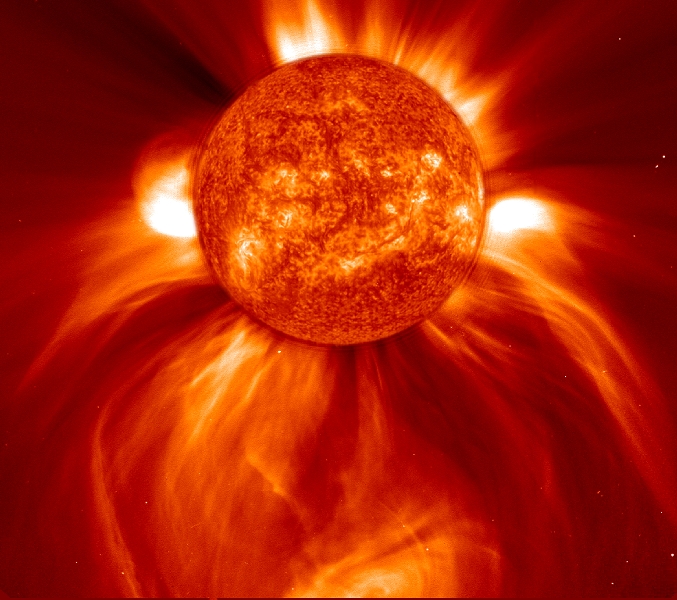
Blasting CME
During the solar maximum there are many sunspots, solar flares, and coronal mass ejections, all of which can affect communications and weather here on Earth.
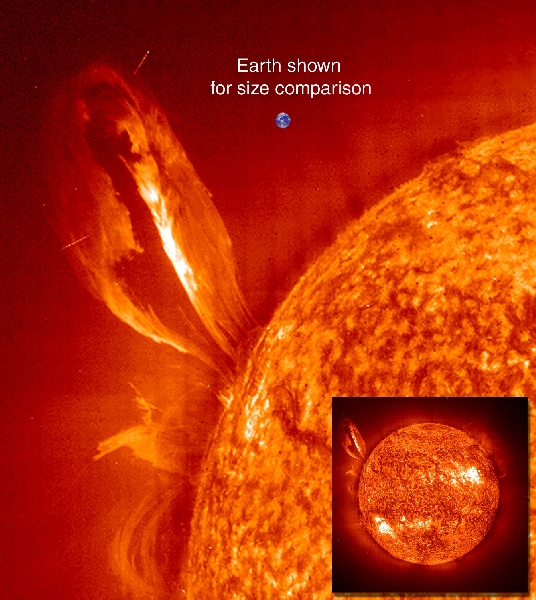
Large, eruptive prominence in He II at 304Å, with an image of the Earth added for size comparison. This prominence from 24 July 1999 is particularly large and looping, extending over 35 Earths out from the Sun. Erupting prominences (when Earthward directed) can affect communications, navigation systems, even power grids, while also producing auroras visible in the night skies.
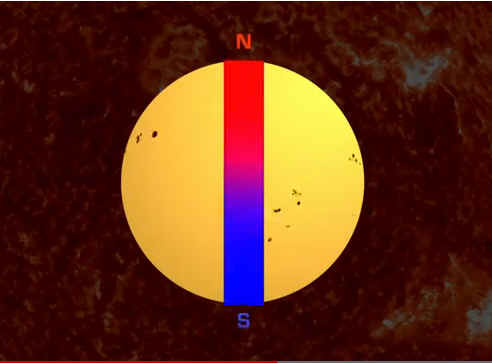
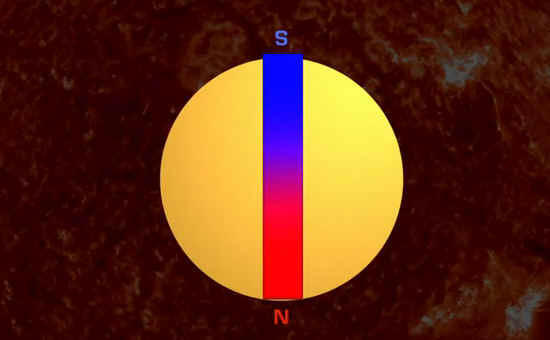
Hale Cycle
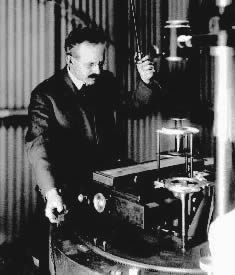
The approximate 22-year cycle in which the magnetic polarity of sunspot pairs reverses and then returns to its original state; during half the cycle, for example, the leading spot in every pair will have a positive polarity but during the other half, the leading spot will be negative. It is named after George Hale who discovered it in 1925.
George Hale Courtesy The Archives, California Institute of Technology Solar Maximum
Every 11 years the sun undergoes a period of activity called the "solar maximum", followed by a period of quiet called the "solar minimum". During the solar maximum there are many sunspots, solar flares, and coronal mass ejections, all of which can affect communications and weather here on Earth.
Solar maximum or solar max is the period of greatest solar activity in the solar cycle of the sun. During solar maximum, sunspots appear. Solar maximum is contrasted with solar minimum. Solar maximum is the period when the suns magnetic field lines are the most distorted due to the magnetic field on the solar equator rotating at a slightly faster pace than at the solar poles. The sun takes about 11 years to go from one solar maximum to another and 22 years to complete a full cycle (where the magnetic charge on the poles is the same).
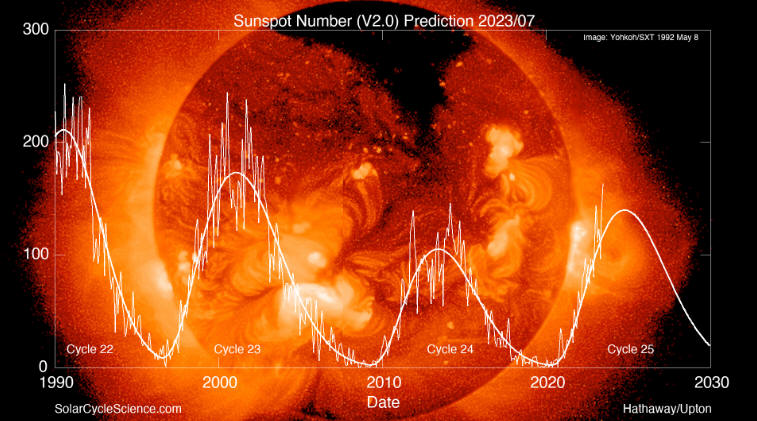
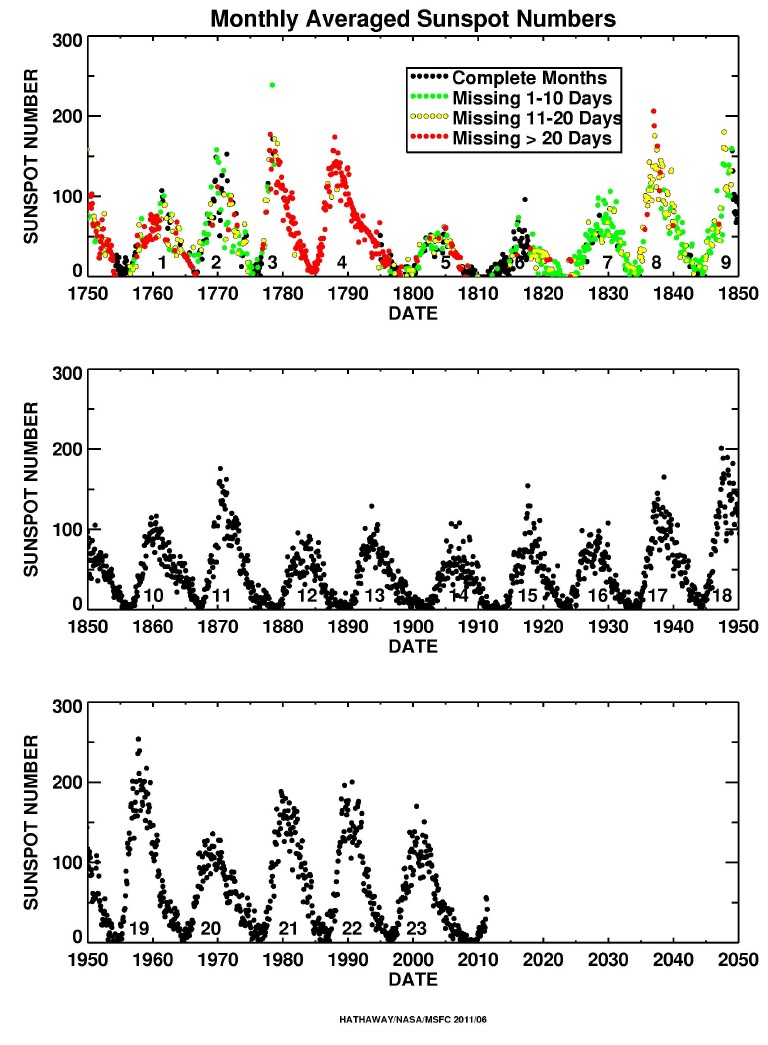
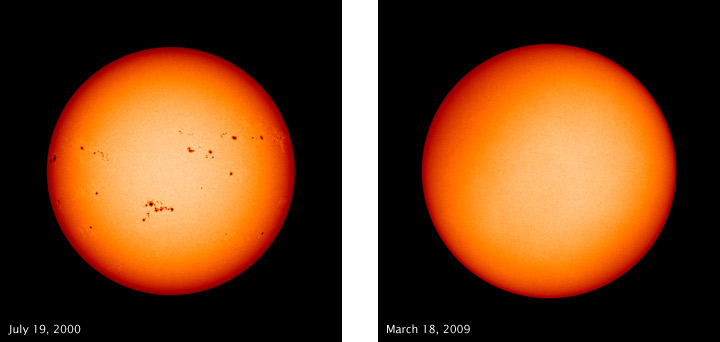
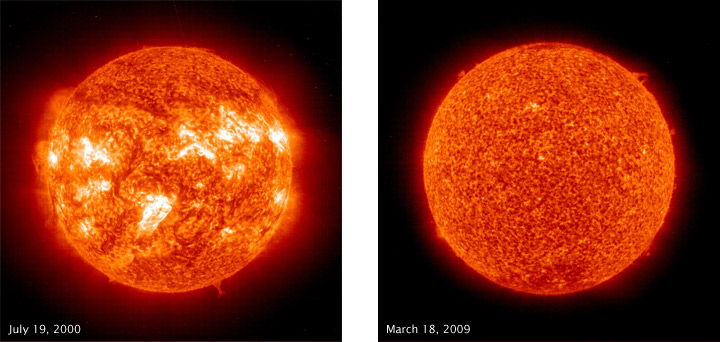
The Sun, a roiling ball of plasma, occupies its place in space approximately 93 million miles from Earth. Though it seems simple to inhabitants of this planet -- the Sun shines, giving light and heat -- the processes occurring in the Sun are so complex that many scientists devote their careers to just one aspect of solar activity. Changes in the activity of the Sun particularly engage solar scientists. Whether fluctuations in the solar magnetic field, expulsions of plasma called coronal mass ejections, emissions of high-energy flares, or changes in the sunspot number, variations in solar activity can be dramatic and therefore highly interesting. Through careful study of solar activity (particularly sunspots, visible from Earth through telescopes) over hundreds of years, scientists have found a consistent cycle of activity: every eleven years, activity rises to a maximum, then falls to a minimum. To track the solar cycle, scientists plot the average of Wolf numbers (values from a method of counting sunspots devised by Johann Rudolf Wolf in 1848) from various observatories daily to get a sunspot number graph. The sunspot or solar cycle does not have the same magnitude every eleven years, however. Entire cycles can have lower activity levels than usual, as during the Maunder Minimum from 1645 to 1700, or the upcoming maximum might have more activity than ever. Sunspots at Solar Maximum and Minimum
These images from
the Solar and Heliospheric Observatory (SOHO) spacecraft compare sunspots on the
Sun’s surface (top row) and ultraviolet light radiating from the solar
atmosphere (bottom row) at the last solar maximum (2000, left column) and at the
current solar minimum (2009, right column.) The sunspot images were captured by
the Michelson Doppler Imager (MDI) using filtered visible light. On March 18,
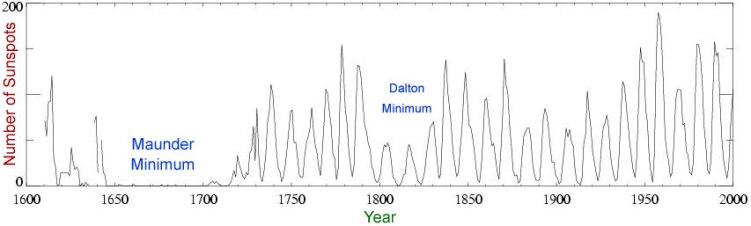
2009, the face of the Sun was spotless. The Maunder Minimum Early records of sunspots indicate that the Sun went through a period of inactivity in the late 17th century. Very few sunspots were seen on the Sun from about 1645 to 1715 . Although the observations were not as extensive as in later years, the Sun was in fact well observed during this time and this lack of sunspots is well documented. This period of solar inactivity also corresponds to a climatic period called the "Little Ice Age" when rivers that are normally ice-free froze and snow fields remained year-round at lower altitudes. There is evidence that the Sun has had similar periods of inactivity in the more distant past. The connection between solar activity and terrestrial climate is an area of on-going research. It is named after the solar astronomer Edward W. Maunder (1851–1928) who studied changes of sunspots latitudes in different times and also during second part of 17th Century.
The Dalton Minimum The Dalton Minimum was a period of low solar activity, named for the English meteorologist John Dalton, lasting from about 1790 to 1830. Like the Maunder Minimum and Spörer Minimum, the Dalton Minimum coincided with a period of lower-than-average global temperatures. The Oberlach Station in Germany, for example, experienced a 2.0° C decline over 20 years. The Year Without a Summer, in 1816, also occurred during the Dalton Minimum.
There have been several other less dramatic dips in the level of solar activity, in terms of sunspot counts, over time. These include Spörer Minimum (1450 to 1540), Wolf Minimum (1280 to 1340), and Oort Minimum (1010 to 1050). Based on evidence other than direct observations of sunspot counts, in total there seem to have been 18 periods of sunspot minima in the last 8,000 years, and studies indicate that the Sun currently spends up to a quarter of its time in these minima. There have also been periods of enhanced solar activity in terms of greater sunspot counts. The Medieval Maximum lasted from about 1100 to 1250, and roughly corresponds to an extended warm period of Earth's (or maybe just Europe's) climate called the Medieval Warm Period that lasted from the 10th to the 14th century... further fueling speculation about possible links between solar activity and Earth's climate.
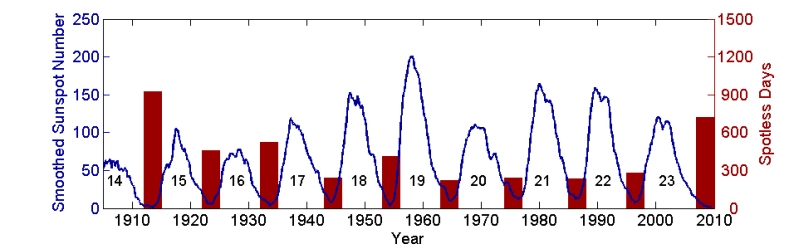
Sunspot cycles over the last century. The blue curve shows the cyclic variation in the number of sunspots. Red bars show the cumulative number of sunspot-less days. The minimum of sunspot cycle 23 was the longest in the space age with the largest number of spotless days.
Discover the Sun! (solarcyclescience.com)
Credit: NASA, SOHO, JPL , LASCO |