|
||||||||||||
|
|
|
The Sun
The Sun, A Real Star-NASA EClips
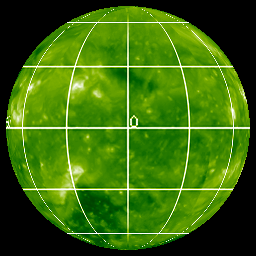
STEREO (Solar TErrestrial RElations Observatory) Image
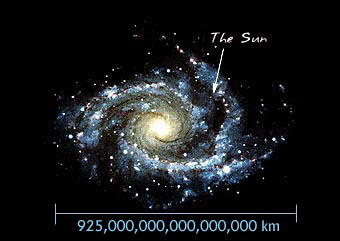
The Milky Way
The Sun is a medium size star known as a yellow dwarf. The Sun is just one of about 100 billion stars in our galaxy, The Milky Way. The Sun is by far the largest object in the solar system. It contains more than 99.8% of the total mass of the Solar System . The Sun is about 93 million miles away from the Earth. The distance from the Earth to the Sun varies throughout the year. At its closest, the Sun is 91.1 million miles from Earth. At its farthest the distance between the Sun and the Earth is 94.2 million miles. It takes light 8 min. 20 sec to travel from the sun to the Earth.
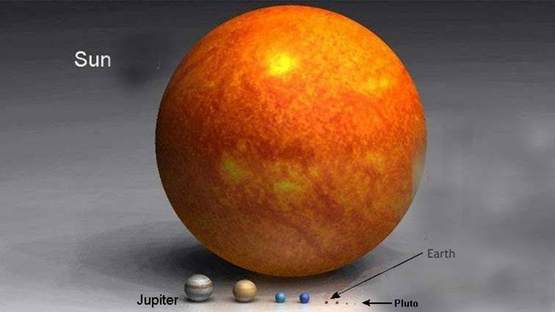
The Sun Dwarfs The Planets In Size
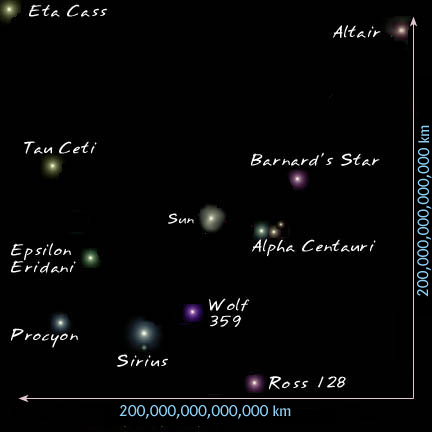
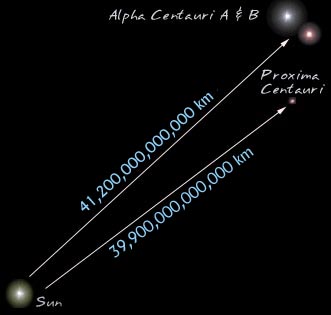
The nearest stars to our sun are:
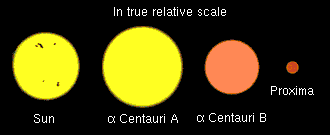
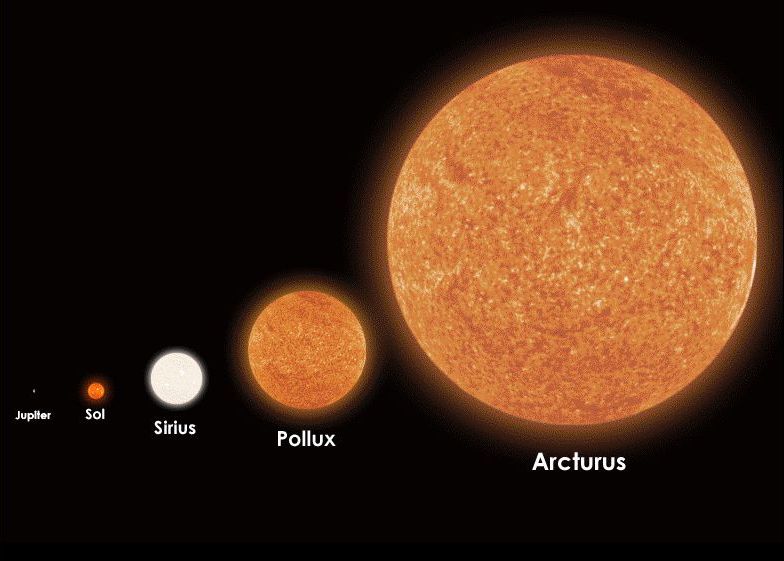
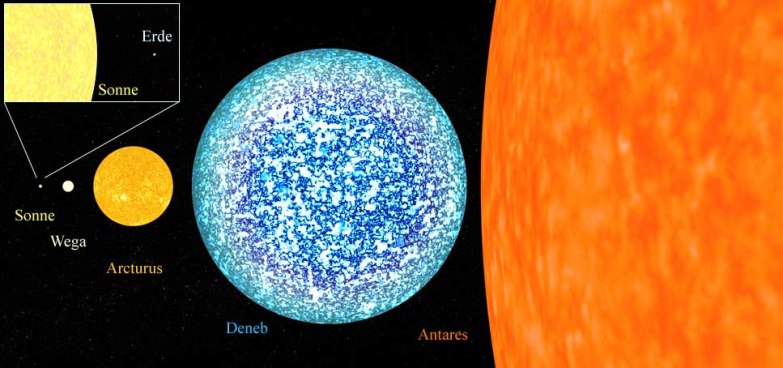
Comparative size of selected Stars
"Erde" means Earth, "Sonne" is "the Sun" A light-year is a unit of length used by astronomers to measure interstellar distance (the distance between stars). A light-year is defined as the distance that light will travel in a year. The speed of light is 186,000 miles per second (300,000 km per second). 186,000 mi/sec x 60 sec/min x 60 min/hr x 24 hr/day x 365 days/yr one light-year is equal to 9,500,000,000,000 kilometers or 5,865,696,000,000 miles
The Sun is personified in many cultures: the Greeks called it Helios, the Egyptians principal god was Ra the sun god and the Romans called it Sol.
The Sun is an average star, similar to millions of others in the Universe. It is classified as a yellow dwarf of spectral class G2.
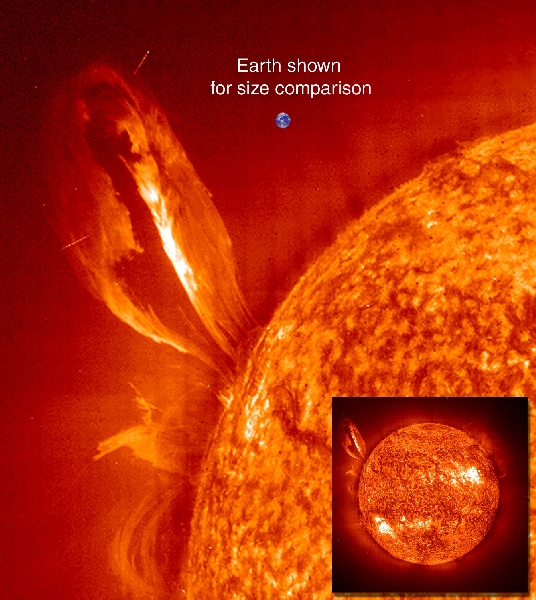
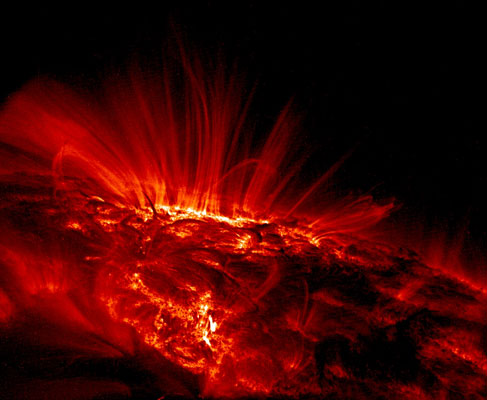
Sunspot Loops
This ultraviolet image shows bright, glowing arcs of gas flowing around the
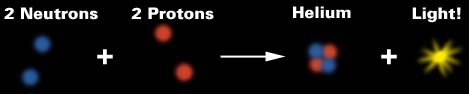
sunspots. It is a prodigious energy machine, manufacturing about 4.0E023 kilowatts of energy per second. In other words, if the total output of the Sun was gathered for one second it would provide the U.S. with enough energy, at its current usage rate, for the next 9,000,000 years. The basic energy source for the Sun is nuclear fusion, which uses the high temperatures and densities within the core to fuse hydrogen, creating energy and producing helium as a by-product. The core is so dense and the size of the Sun so great that energy released at the center of the Sun takes about 50,000,000 years to make its way to the surface, undergoing countless absorptions and reemissions in the process. The Sun's visible surface, called the photosphere, has a temperature of 5,700 C(10,900 Degrees F). The gases heat up and become more compressed at deeper levels, until the temperature reaches 15 million C( 27 Million Degrees F) deep within the Sun's energy producing core (If the Sun were to stop producing energy today, it would take 50,000,000 years for the effects to be felt at Earth! Layers of the SunThe center of the SunThe center of the sun is very hot (about 15 million degrees Celsius) and the pressure is immense (about 100 billion times the airpressure here on Earth). Because of that, atoms come so close to each other that they fuse.
In every second, the Sun spends 700 billion tons of protons (or: Hydrogen) in this way. And only a small fraction (0.7 percent) is turned into light. Right now, about half of the amount of Hydrogen in the core of the Sun has been fused into Helium. 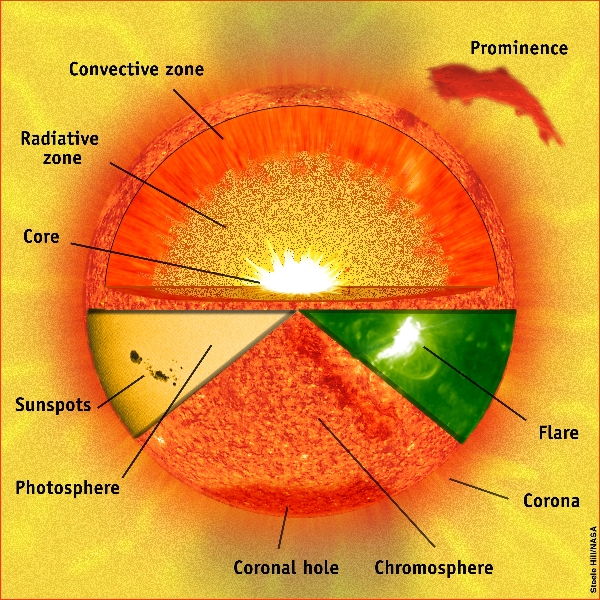
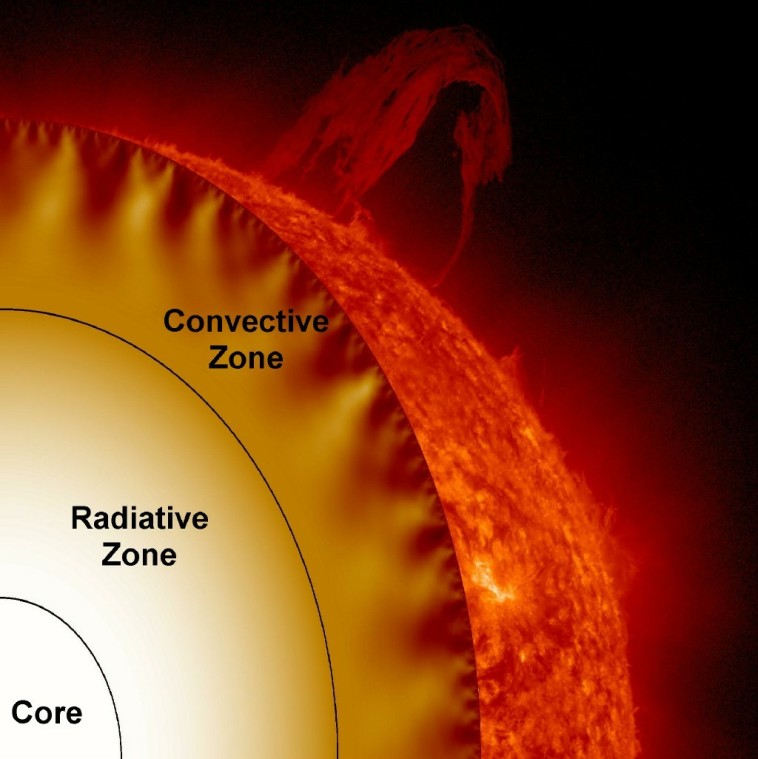
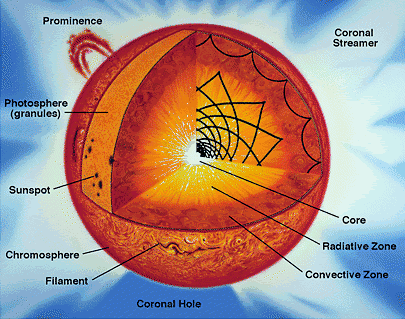
The Sun, can be divided into six layers. From the center out, the layers of the Sun are as follows: the solar interior composed of the core (which occupies the innermost quarter or so of the Sun's radius), the radiative zone, and the the convective zone, then there is the visible surface known as the photosphere, the chromosphere, and finally the outermost layer, the corona.
The innermost layer of the sun is the core. With a density of 160 g/cm^3, 10 times that of lead, the core might be expected to be solid. However, the core's temperature of 15 million kelvins (27 million degrees Fahrenheit) keeps it in a gaseous state.
The Core In the core, fusion reactions produce energy in the form of gamma rays and neutrinos. Gamma rays are photons with high energy and high frequency. The gamma rays are absorbed and re-emitted by many atoms on their journey from the envelope to the outside of the sun. When the gamma rays leave atoms, their average energy is reduced. However, the first law of thermodynamics (which states that energy can neither be created nor be destroyed) plays a role and the number of photons increases. Each high-energy gamma ray that leaves the solar envelope will eventually become a thousand low-energy photons. The neutrinos are extremely nonreactive. To stop a typical neutrino, one would have to send it through a light-year of lead! Several experiments are being performed to measure the neutrino output from the sun. Chemicals containing elements with which neutrinos react are put in large pools in mines, and the neutrinos' passage through the pools can be measured by the rare changes they cause in the nuclei in the pools. For example, perchloroethane contains some isotopes of chlorine with 37 particles in the nucleus (17 protons, 20 neutrons). These Cl-37 molecules can take in neutrinos and become radioactive Ar-37 (18 protons, 19 neutrons). From the amount of argon present, the number of neutrinos can be calculated. The Radiative Zone The radiative zone extends
outward from the outer edge of the core to the interface layer or tachocline at
the base of the convection zone (from 25% of the distance to the surface to 70%
of that distance). The radiative zone is characterized by the method of energy
transport - radiation. The energy generated in the core is carried by light
(photons) that bounces from particle to particle through the radiative zone. The Interface Layer (Tachocline) The interface layer lies between
the radiative zone and the convective zone. The fluid motions found in the
convection zone slowly disappear from the top of this layer to its bottom where
the conditions match those of the calm radiative zone. This thin layer has
become more interesting in recent years as more details have been discovered
about it. The Convection Zone
Convection occurs when the temperature gradient (the rate at which the temperature falls with height or radius) gets larger than the adiabatic gradient (the rate at which the temperature would fall if a volume of material were moved higher without adding heat). Where this occurs a volume of material moved upward will be warmer than its surroundings and will continue to rise further. These convective motions carry heat quite rapidly to the surface. The fluid expands and cools as it rises. At the visible surface the temperature has dropped to 5,700°K and the density is only 0.0000002 gm/cm³ (about 1/10,000th the density of air at sea level). The convective motions themselves are visible at the surface as granules and supergranules. Outside of the core is the radiative envelope, which is surrounded by the convective envelope. The temperature is 4 million kelvins (7 million degrees F). The density of the solar envelope is much less than that of the core. The core contains 40 percent of the sun's mass in 10 percent of the volume, while the solar envelope has 60 percent of the mass in 90 percent of the volume. The solar envelope puts pressure on the core and maintains the core's temperature. The hotter a gas is, the more transparent it is. The solar envelope is cooler and more opaque than the core. It becomes less efficient for energy to move by radiation, and heat energy starts to build up at the outside of the radiative zone. The energy begins to move by convection, in huge cells of circulating gas several hundred kilometers in diameter. Convection cells nearer to the outside are smaller than the inner cells. The top of each cell is called a granule. Seen through a telescope, granules look like tiny specks of light. Variations in the velocity of particles in granules cause slight wavelength changes in the spectra emitted by the sun. PhotosphereThe photosphere is the zone from which the sunlight we see is emitted. The photosphere is a comparatively thin layer of low pressure gasses surrounding the envelope. It is only a few hundred kilometers thick, with a temperature of 6000 K. The composition, temperature, and pressure of the photosphere are revealed by the spectrum of sunlight. In fact, helium was discovered in 1896 by William Ramsey, when in analyzing the solar spectrum he found features that did not belong to any gas known on earth. The newly-discovered gas was named helium in honor of Helios, the mythological Greek god of the sun. ChromosphereIn an eclipse, a red circle around the outside of the sun can sometimes can be seen. This is the chromosphere. Its red coloring is caused by the abundance of hydrogen. From the center of the sun to the chromosphere, the temperature decreases proportionally as the distance from the core increases. The chromosphere's temperature, however, is 7000 K, hotter than that of the photosphere. Temperatures continue to increase through the corona. CoronaThe outermost layer of the sun is the corona. Only visible during eclipses, it is a low density cloud of plasma with higher transparency than the inner layers. The white corona is a million times less bright than the inner layers of the sun, but is many times larger. The corona is hotter than some of the inner layers. Its average temperature is 1 million K (2 million degrees F) but in some places it can reach 3 million K (5 million degrees F). Temperatures steadily decrease as we move farther away from the core, but after the photosphere they begin to rise again. There are several theories that explain this, but none have been proven.
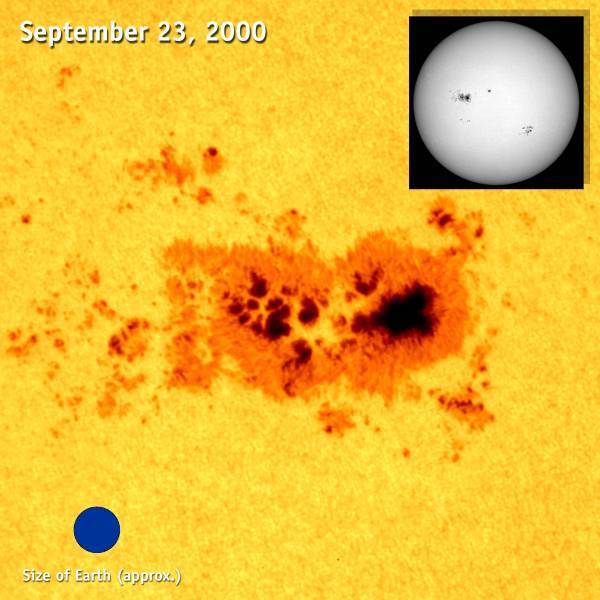
Sunspots
Large sunspot group -- Active region 9169
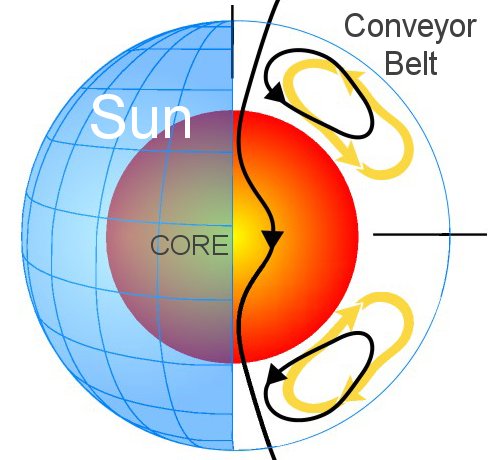
Sunspots are dark spots on the photosphere, typically with the same diameter as the Earth. They have cooler temperatures than the photosphere. The center of a spot, the umbra, looks dark gray if heavily filtered and is only 4500 K (as compared to the photosphere at 6000K). Around it is the penumbra, which looks lighter gray (if filtered). Sunspots come in cycles, increasing sharply (in numbers) and then decreasing sharply. The period of this solar cycle is about 11 years. The sun has enormous organized magnetic fields that reach from pole to pole. Loops of the magnetic field oppose convection in the convective envelope and stop the flow of energy to the surface. This results in cool spots at the surface which produce less light than the warmer areas. These cool, dark spots are the sunspots. The Great Conveyor Belt is a massive circulating current of fire (hot plasma) within the sun. It has two branches, north and south, each taking about 40 years to complete one circuit. Researchers believe the turning of the belt controls the sunspot cycle.
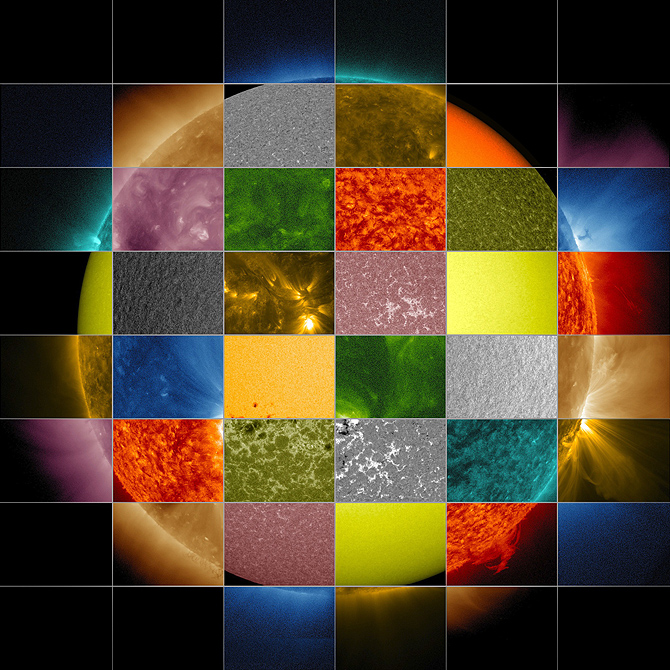
This collage of solar images from NASA's Solar Dynamics Observatory (SDO) shows how observations of the sun in different wavelengths helps highlight different aspects of the sun's surface and atmosphere. (The collage also includes images fr...om other SDO instruments that display magnetic and Doppler information.) Credit: NASA/SDO/Goddard Space Flight Center
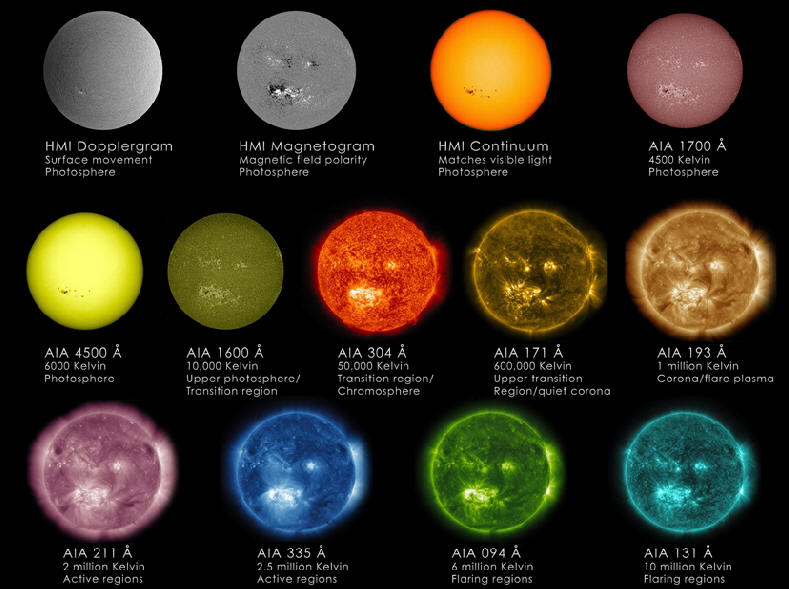
HMI Dopplergram
Dopplergrams provide maps of velocity on the sun's surface. Solar Region: Photosphere HMI Magnetogram Magnetograms show maps of the magnetic field on the sun’s surface, with black showing magnetic field lines pointing away ...from Earth, and white showing magnetic field lines coming toward Earth. Solar Region: Photosphere HMI Continuum Continuums provide photographs of the solar surface, incorporating a broad range of visible light. Solar Region: Photosphere AIA 1700 Ultraviolet light continuum, shows the surface of the sun. As well as a layer of the sun's atmosphere called the chromosphere, which lies just above the photosphere and is where the temperature begins rising. Temperatures: 4500 Kelvin, Solar Region: Photosphere/Chromosphere AIA 4500 White light continuum showing the sun's surface or photosphere. Temperatures: 6000 Kelvin, Solar Region: Photosphere AIA 1600 Emitted by carbon-4 (C IV) at around 10,000 Kelvin. C IV at these temperatures is present in the upper photosphere and what's called the transition region, a region between the chromosphere and the upper most layer of the sun's atmosphere called the corona. The transition region is where the temperature rapidly rises. SDO images of this wavelength are typically colorized in dark yellow. Solar Region: Upper Photosphere/Transition Region AIA 304 Emitted by helium-2 (He II) at around 50,000 Kelvin. This light is emitted from the chromosphere and transition region. SDO images of this wavelength are typically colorized in red. Solar Region: Transition Region/Chromasphere AIA 171 Emitted by iron-9 (Fe IX) at around 600,000 Kelvin. This wavelength shows the quiet corona and coronal loops, and is typically colorized in gold. Solar Region: Upper Transition Region/Quiet Corona AIA 193 Emitted by iron-12 (Fe XII) at 1,000,000 K and iron 24 (Fe XXIV) at 20,000,000 Kelvin. The former represents a slightly hotter region of the corona and the later represents the much hotter material of a solar flare. This wavelength is typically colorized in light brown. Solar Region: Corona/Flare Plasma AIA 211 Emitted by iron-14 (Fe XIV) at temperatures of 2,000,000 Kelvin. These images show hotter, magnetically active regions in the sun's corona and are typically colorized in purple. Solar Region: Active Regions AIA 335 Emitted by iron-16 (Fe XVI) at temperatures of 2,500,000 Kelvin. These images also show hotter, magnetically active regions in the corona, and are typically colorized in blue. Solar Region: Active Regions AIA 094 Emitted by iron-18 (Fe XVIII) at temperatures of 6,000,000 Kelvin. Temperatures like this represent regions of the corona during a solar flare. The images are typically colorized in green. Solar Region: Flaring Regions AIA 131 Emitted by iron-20 (Fe XX) and iron-23 (Fe XXIII) at temperatures greater than 10,000,000 Kelvin, representing the material in flares. The images are typically colorized in teal. Solar Region: Flaring Regions
|
|||||||||||||||||||||||||||||||||||||||||||||||||||||||||||||||||||||||||||||||||||||||||||||||||||||||||||||||||||||||||||||||||||||||||||||||||||||||
Credit: NASA, SOHO, JPL , LASCO |