|
||||||||||||
|
|
|
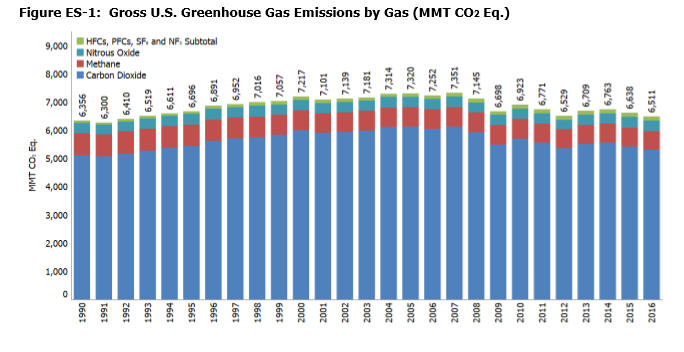
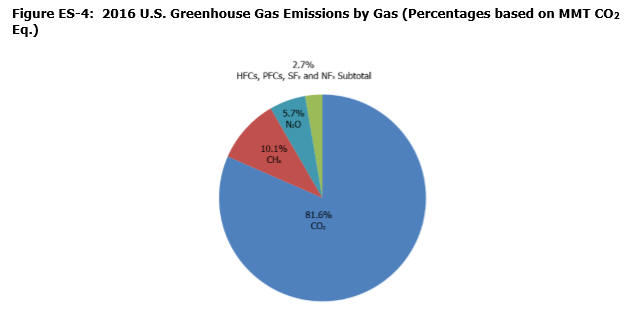
U.S. Greenhouse Gas Emissions In 2016, total gross U.S. greenhouse gas emissions were 6,511.3 million metric tons (MMT) of CO2 Eq.11 Total U.S. emissions have increased by 2.4 percent from 1990 to 2016, and emissions decreased from 2015 to 2016 by 1.9 percent (126.8 MMT CO2 Eq.). The decrease in total greenhouse gas emissions between 2015 and 2016 was driven in large part by a decrease in CO2 emissions from fossil fuel combustion. The decrease in CO2 emissions from fossil fuel combustion was a result of multiple factors, including: (1) substitution from coal to natural gas and other non-fossil energy sources in the electric power sector; and (2) warmer winter conditions in 2016 resulting in a decreased demand for heating fuel in the residential and commercial sectors. Relative to 1990, the baseline for this Inventory, gross emissions in 2016 are higher by 2.4 percent, down from a high of 15.7 percent above 1990 levels in 2007. Overall, net emissions in 2016 were 11.1 percent below 2005 levels as shown in Table ES-2. Figure ES-1 through Figure ES-3 illustrate the overall trends in total U.S. emissions by gas, annual changes, and absolute change since 1990, and Table ES-2 provides a detailed summary of gross U.S. greenhouse gas emissions and sinks for 1990 through 2016. Note, unless otherwise stated, all tables and figures provide total gross emissions, and exclude the greenhouse gas fluxes from the Land Use, Land-Use Change, and Forestry (LULUCF) sector
|