.jpg) |
|
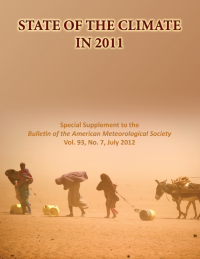
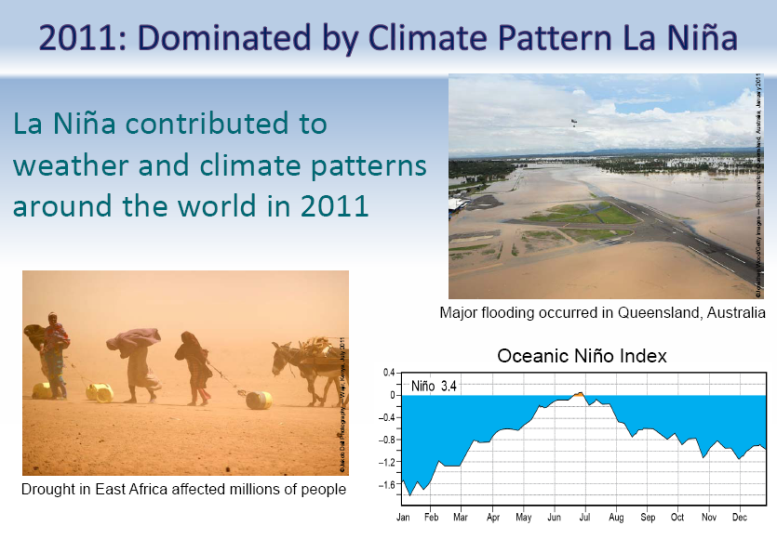
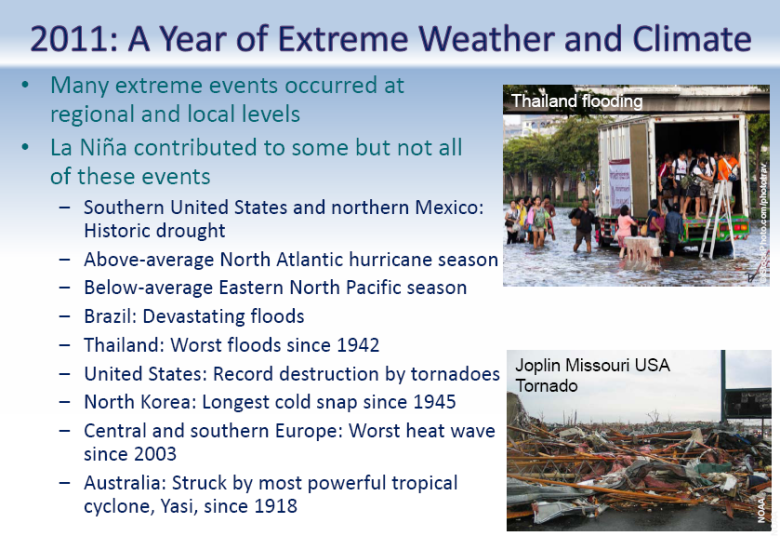
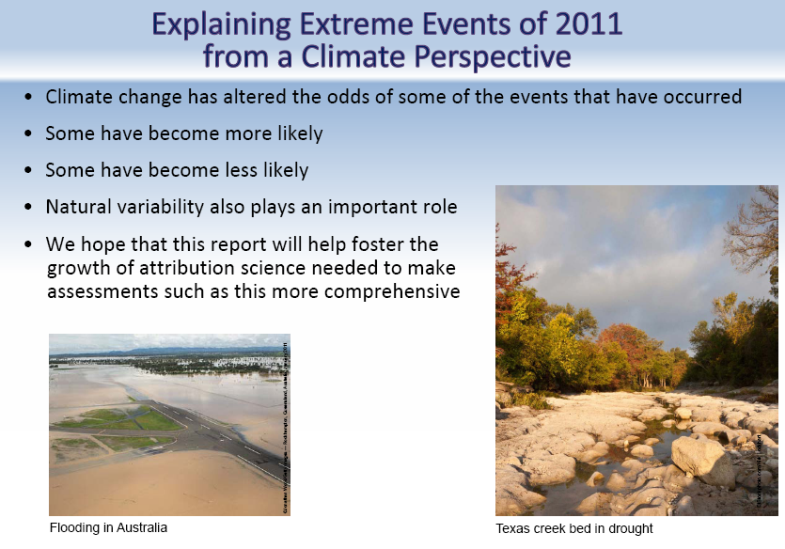
State of the Climate Global Analysis Annual 2011 Back-to-back La Niñas cooled globe and influenced extreme weather in 2011New NOAA-led report examines climate conditions experienced around the worldJuly 10, 2012 Worldwide, 2011 was the coolest year on record since 2008, yet temperatures remained above the 30 year average, according to the 2011 State of the Climate report released online today by NOAA. The peer-reviewed report, issued in coordination with the American Meteorological Society (AMS), was compiled by 378 scientists from 48 countries around the world. It provides a detailed update on global climate indicators, notable weather events and other data collected by environmental monitoring stations and instruments on land, sea, ice and sky. “2011 will be remembered as a year of extreme events, both in the United States and around the world,” said Deputy NOAA Administrator Kathryn D. Sullivan, Ph.D. “Every weather event that happens now takes place in the context of a changing global environment. This annual report provides scientists and citizens alike with an analysis of what has happened so we can all prepare for what is to come.” Two back-to-back La Niñas, each characterized by cooler-than-average water temperatures in the eastern equatorial Pacific, affected regional climates and influenced many of the world’s significant weather events throughout the year. These included historic droughts in East Africa, the southern United States and northern Mexico. La Niña conditions contributed to an above-average tropical cyclone season in the North Atlantic hurricane basin and a below-average season in the Eastern North Pacific. It was also associated with the wettest two-year period (2010–2011) on record in Australia, which was particularly remarkable as the wet conditions followed a decade-long dry spell.
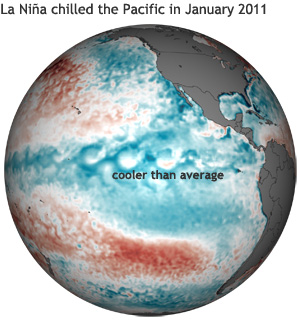
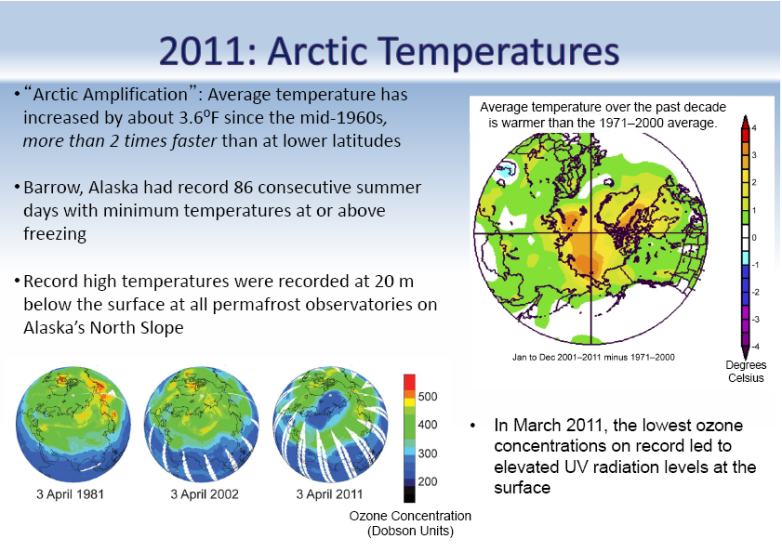
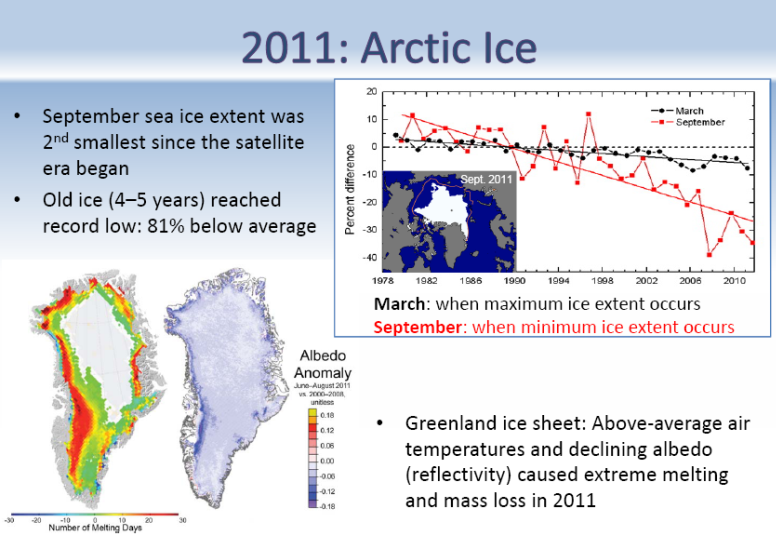
The lead character of the 2011 climate story was a double dip La Niña, which chilled the Pacific at the start and end of the year. Many of the 2011 seasonal climate patterns around the world were consistent with common side effects of La Niña The Arctic continued to show more rapid changes than the rest of the planet. Sea ice shrank to its second smallest “summer minimum” extent on record during 2011, as older ice (four to five years old) reached a new record minimum at more than 80 percent below average. Overall, glaciers around the world continued to lose mass. Loss from Canadian Arctic glaciers and ice caps were the greatest since measurements began in 2002.
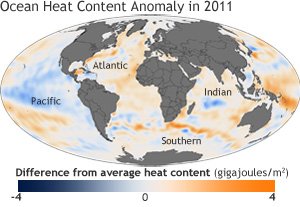
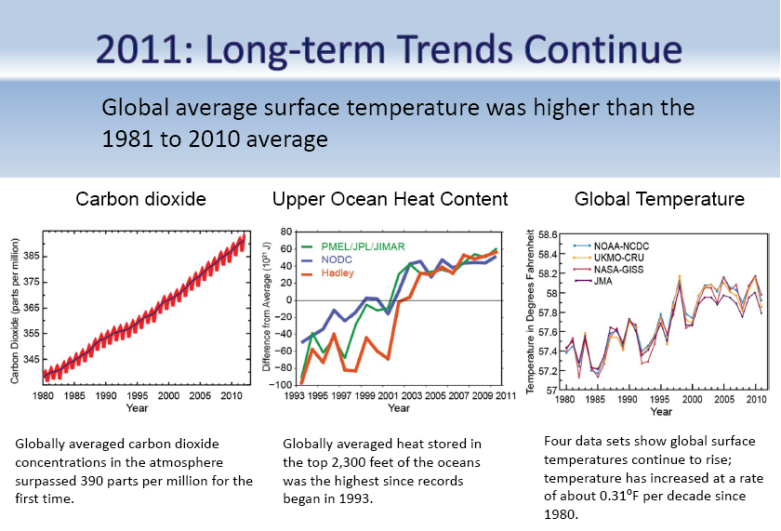
La Niña chilled the eastern tropical Pacific in 2011, but ocean heat content nearly everywhere else was above the long-term average The report used 43 climate indicators to track and identify changes and overall trends to the global climate system. These indicators include greenhouse gas concentrations, temperature of the lower and upper atmosphere, cloud cover, sea surface temperature, sea level rise, ocean salinity, sea ice extent and snow cover. Each indicator includes thousands of measurements from multiple independent datasets. Highlights:
Global Highlights
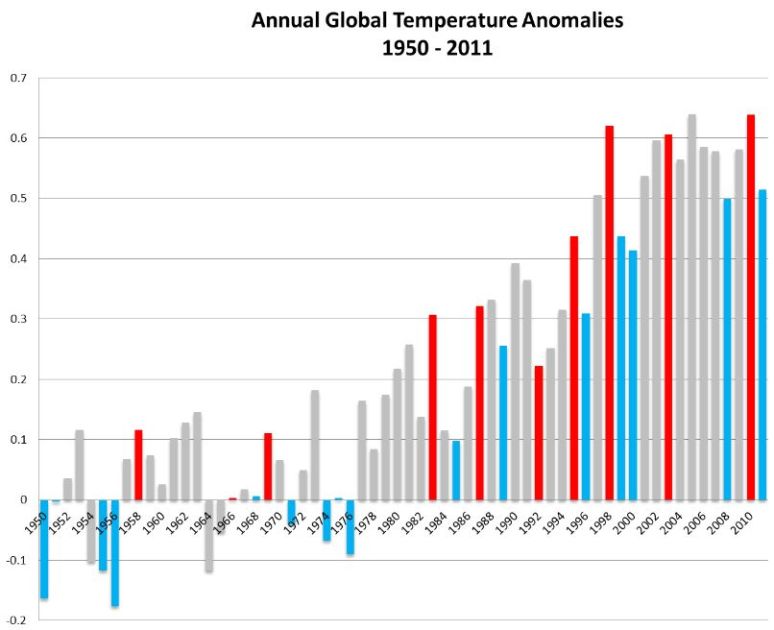
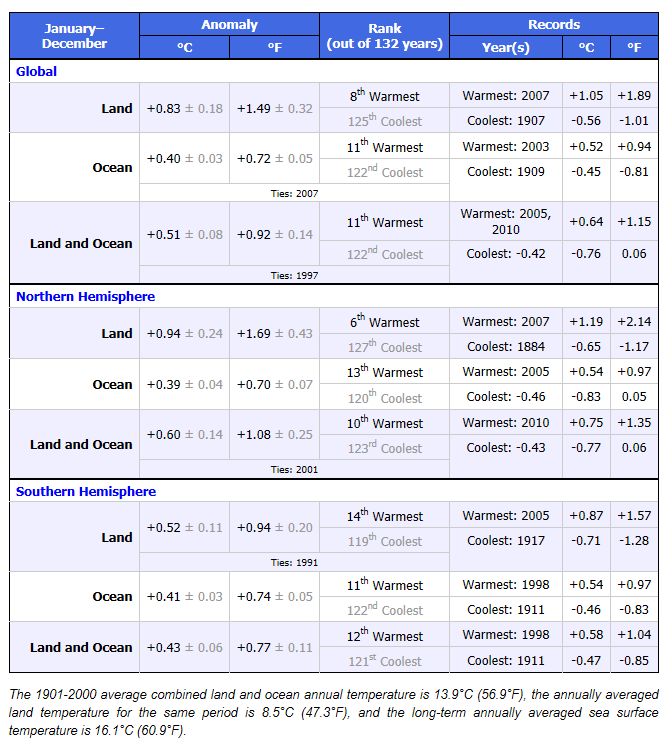
Global TemperaturesThe year 2011 tied with 1997 as the 11th warmest year since records began in 1880. The annually-averaged temperature over global land and ocean surfaces was 0.51°C (0.92°F) above the 20th century average of 13.9°C (57.0°F). This marks the 35th consecutive year (since 1976) that the yearly global temperature was above the 20th century average. The warmest years on record were 2010 and 2005, which were 0.64°C (1.15°F) above average. Including 2011, all eleven years in the 21st century so far (2001–2011) rank among the 13 warmest in the 132-year period of record. Only one year during the 20th century, 1998, was warmer than 2011.
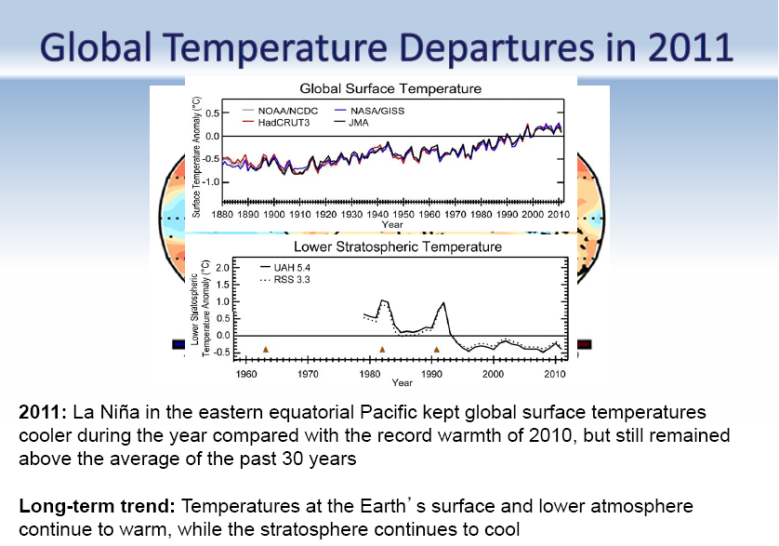
Natural climate patterns that persist for days, months, or even years can affect weather patterns around the world and impact the average global temperature. One such well-known global-scale pattern—the El Niño-Southern Oscillation (ENSO)—is a natural episodic fluctuation in sea surface temperature (El Niño) and the air pressure of the overlying atmosphere (Southern Oscillation) across the equatorial Pacific Ocean. Over a period of months to a few years, ENSO fluctuates between warmer-than-average ocean surface waters (El Niño) and cooler-than-average ocean surface waters (La Niña) in that region. Two separate cool-phase La Niña events took place in 2011, according to NOAA's Climate Prediction Center (CPC). These events affected weather patterns in many parts of the world during the year and dampened the global temperature compared with the record warmth of the previous year, 2010 (which is tied for warmest with 2005). The coolest monthly global anomalies occurred during the beginning of the year, where both January and February each ranked as 17th warmest for their respective months. Monthly temperature anomalies increased as the La Niña episode waned and ENSO-neutral conditions emerged during May. June and July ranked as the seventh warmest for their respective months while August and September each ranked eighth warmest. La Niña conditions returned in October and moderately strengthened during the remainder of the year. Global monthly temperature anomalies during this period cooled compared to those during the middle of the year. With CPC ENSO records dating back to 1950, 2011 ranked as the warmest "La Niña year" in the 1950–2011 period of record. Two of the three warmest years on record (2010 and 1998) are "El Niño years". A La Niña (El Niño) year is defined here as occurring when the first three months of a calendar year meet the La Niña (El Niño) criteria as defined by the CPC.
Global Annual Temperature Anomalies Separately, the average global land
temperature was 0.83°C (1.49°F) above the 20th century average and ranked
as the eighth warmest year on record. It was also the warmest annual
global temperature over land during a La Niña year. The average monthly
land temperature anomaly ranged from 0.45°C (0.81°F; January) to 1.12°C
(2.02°F; April), a difference of 0.67°C (1.21°F).
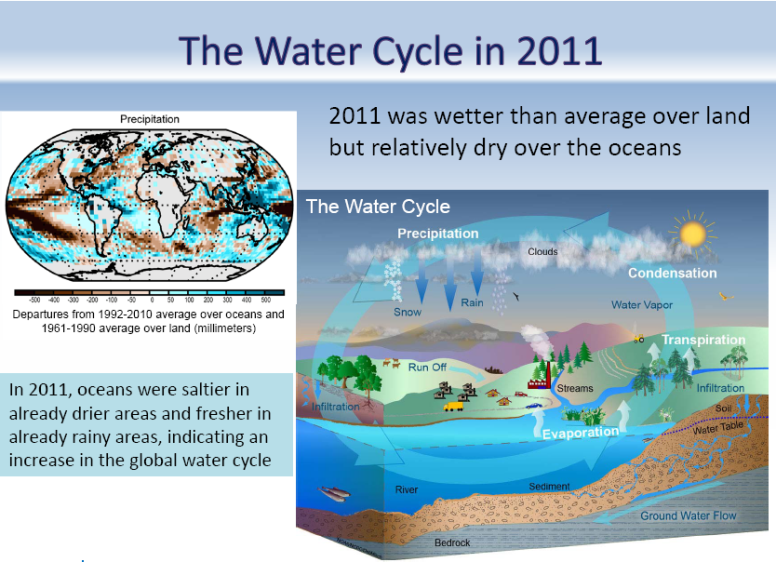
Regional TemperaturesWarmer-than-average temperatures occurred during 2011 for most of the world's surface. The greatest above-average annual temperature anomalies occurred across the Northern Hemisphere high latitude land areas, particularly central and northern Russia, Scandinavia, and Canada. Also noteworthy, it was warmer than average across the eastern half of the United States, Mexico, most of Europe and Africa, and the north central Pacific Ocean. Temperatures were below normal across the eastern and central Pacific Ocean, west central North America, and north and central Australia. A natural hemispheric-scale climate pattern called the Arctic Oscillation (AO) can be a dominating driver of winter temperatures in the Northern Hemisphere. Its effects were particularly felt during January, when the AO was strongly negative. A negative AO is associated with cold polar air that spills southward into the mid-latitudes from the Arctic region and warm air that advects northward. Due at least in part to this pattern, the contiguous United States reported its coolest January since 1994. December 2010 was also slightly below average, helping to bring the United States its second cooler-than-normal winter (December–February) in a row. In China, 2011 was also off to a cold start. It was the coolest January, behind 1977, since records began in 1961. In Europe, the UK reported its second coolest winter (behind 2009/10) since 1985/86. Conversely, in the higher northern latitudes, Canada reported its sixth warmest winter since national records began in 1948. The warmest winter occurred the previous year (2009/10). Most of the above-normal temperatures occurred in the northern half of the country. Temperatures were more than 4°C (7°F) above normal for large areas of Nunavut, northern Quebec, and Labrador. The negative-phase AO contributed to these warm northern temperatures. In the Southern Hemisphere, the summer (December 2010–February 2011) was Australia's coolest since 2001. These cooler temperatures can be attributed in part to the ongoing La Niña event. Cool conditions, in association with increased cloudiness and above-average rainfall, continued across Australia into March as nationally-averaged March daytime temperatures ranked as the coolest March on record. With cool conditions persisting into April and May, Australia had its coolest autumn (March–May) on record. Parts of Western Europe reported record or near-record warmth during April. Germany experienced its second warmest April since national records began in 1881, behind April 2009, with the average nationwide temperature almost 4.4°C (7.9°F) above average. It was the warmest April on record across the United Kingdom, with temperatures 3°C to 5°C (5°F to 9°F) above normal in many areas, breaking the previous record set in 2007 by 0.5°C (0.9°F). This warmth also contributed to the UK's warmest spring on record (tied with 2007). Spain experienced its third warmest May on record, behind 1964 and 2006. But in Australia, the effects of La Niña continued. Cool weather brought the country its seventh coolest May on record and it's coolest May since 2000, at 1.33°C (2.39°F) below averageIn contrast to Australia, New Zealand reported its warmest May since records began in 1909, with the temperature 2.2°C (4.0°F) above the monthly average. New Zealand also had its third warmest June on record, with the temperature 1.5°C (2.7°F) above the monthly average. . Summer was warm across China. June 2011 was the second warmest June for the country since records began in 1951, July was the seventh warmest, and August was the fourth warmest on record. In July, with ENSO-neutral conditions in place, maximum temperatures were above normal for all states and territories in Australia for the first month since April 2010. La Niña conditions during 2010/11 kept temperatures below normal across most of the country for more than a year. The UK had its coolest average monthly July temperature since 2000. The average minimum temperature was the coolest since July 1980. Spain had its coolest July since 2002, although the temperature was only 0.1°C (0.2°F) below the 1971–2000 average. The cooler-than-average temperatures continued into August in some regions. Scotland and Northern Ireland had their coolest average monthly August temperatures since 1993. In North America, a major heat wave contributed to the third warmest July on record for the United States. This warmth was followed by more heat, particularly in the South, giving the U.S. its second warmest August. The warmth in the United States during July and August contributed to the country's second warmest summer. Two states, Oklahoma and Texas, reported the highest U.S. summer temperatures for any state in any year since records began in 1895. In Northern Europe, Finland had its fourth warmest summer since records began in the early 1900s. In Iberia, Spain rebounded from its cool July and reported its sixth warmest August on record since 1961. In the Southern Hemisphere, Australia had its fifth warmest August maximum temperature in the 62-year period of record. As Northern Hemisphere fall (September–November) began, it was the warmest September in Spain since 1990 and fifth warmest in the past 50 years. The UK marked its warmest September since 2006 and sixth warmest in the last 100 years. It also reported its warmest October since 2006 and eighth warmest in the last 100 years. However, most of southern and western South America was cooler than average. According to the Argentina Meteorological Service (Servicio Meteorologico Nacional), several locations in Argentina experienced their coolest October in the past half century. In Asia, China reported its sixth warmest October and third warmest November since national records began in 1951. The November average monthly temperature in Norway was 4.6°C (8.3°F) above average, making this month the country's warmest November since records began in 1900. The average temperature for Northern Norway was 5.3°C (9.5°F) above normal, also a new November record. These warm temperatures helped give Norway its warmest autumn on record. It was also Finland's warmest autumn since 1938. The average November temperature for Austria's high elevation stations was 2.6°C above average, giving this region the second warmest November in the country's 161-year period of record, behind 2006. November 2011 was the second warmest November on record for the UK, behind 1994, at 2.9°C (5.2°F) above normal. It was also the second warmest autumn on record for the UK in more than a century, with temperatures 2.1°C (3.8°F) above average. November 2006 was the warmest at 2.3°C (4.1°F) above average. In Central England, autumn temperatures were the second warmest in at least 350 years. In December, a strong positive Arctic Oscillation kept polar air contained to the very high northern latitudes and much warmer-than-normal temperatures were observed in lower, but still high, northern latitudes. Alaska reported its third warmest December on record and Northern Norway had its 10th warmest December in the 112-year period of record. In Europe, the UK had its sixth warmest December on record. This is more than 5°C (9°F) warmer than the record cold of the previous December (2010), when the Arctic Oscillation was strongly negative. Australia temperatures were plagued by the La Niña that emerged in October. It was the country's coolest December since 2001. For the year, in Northern Europe, the 2011 annually-averaged temperature for Norway was 1.8°C above average, tying with 1990 and 2006 as the country's warmest year on record. Finland tied with 1989 for its second warmest year on record, behind 1938, with March–December all warmer-than-average months. According to the Finnish Meteorological Institute, the average temperature for 2011 was 1.9°C (3.4°F) above the long-term average. In Southern Europe, it was the warmest year on record for Spain, at 1.49°C above the 1971–2000 average. In Western Europe, the UK reported its second warmest year on record, behind 2006. The UK Met Office also reported that the UK's seven warmest years have all occurred within the past decade. Germany reported its fifth warmest year on record, with all months except July warmer than average. The annually-averaged temperature was 0.7°C above the 1981–2010 average. For Austria's high elevation alpine stations, the average temperature was the warmest since records began in 1851, at 1.6°C above the 1971–2000 average, according to ZAMG. This surpassed the previous record set in 1994 by 0.3°C. The average temperature for the country's low elevation stations ranked as sixth warmest on record, at 1.2°C above average. In the Southern Hemisphere, Australia experienced its first cooler-than-average year since 2001, due in part to the impacts of La Niña during most of 2011. New Zealand, which experienced a year of extreme weather, both hot and cold, observed an annually-averaged temperature that was 17th warmest since records began in 1919, or warmer than about 80 percent of all years, according to NIWA. Global PrecipitationGlobal precipitation over land in 2011 was well above the 1961–1990 average for the second year in a row, ranking as the second wettest year on record, behind 2010. Precipitation anomalies were variable across the globe. It was wetter than normal across much of the northeastern United States, Central America, much of coastal South America, Australia, and northwestern China. It was particularly drier than normal in far southwestern Canada, the south central United States, northern Mexico, southern and northeastern China, Mongolia, Hawaii, and French Polynesia and Kiribati in the South Pacific Ocean. La Niña conditions during much of 2011 brought plenty of precipitation to Australia, making 2011 the country's third wettest year since records began in 1900. The Australian Bureau of Meteorology also attributed a record warm eastern Indian Ocean to the extreme wetness. It was particularly wet at the beginning of 2011, as the country reported its second wettest summer (December 2010–February 2011) and wettest March on record. On a longer time scale, the two-year period 2010–2011 ranked as the second wettest such period on record. However, in East Africa, two consecutive seasons of poor rainfall—the short Deyr rains from October to December and the long Gu rains that typically begin in early April but were late and scattered—resulted in one of the driest years since 1950/51, according to the UN's Office for the Coordination of Humanitarian Affairs (OCHA). Somalia, Ethiopia, Eritrea, Kenya, and Djibouti were majorly impacted. The lack of Deyr rains in October–December 2010 was attributed to the ongoing La Niña. On July 19th, the United Nations offically declared a famine in the southern Bakool and Lower Shabelle regions of Somalia, the first time famine has been declared in this country since 1992. Please see the July 2011 Global Hazards report for detailed information. La Niña also played a role in the intense drought observed in northern Mexico and the south central United States. As of the end of November, Mexico was suffering from its worst drought since national records began in 1941. Five states in northern Mexico—Durango, Zacatecas, Chihuahua, Coahuila and San Luis Potosi—were the hardest hit. On average those states had received less than 60 percent of average rainfall for that time period. Devastating drought conditions were seen across much of the southern tier of the United States. Texas, Oklahoma, Louisiana, and New Mexico were particularly hard hit and billions of dollars in economic losses were incurred. Please see the annual U.S. and Drought reports for details. While some parts the U.S. were extremely dry, other parts were record or near-record wet. Two major tropical storm systems, Hurricane Irene and Tropical Storm Lee, each brought heavy rainfall to much of the northeastern U.S. within about a one-week period during late August and early September, respectively. These systems contributed to several states, including heavily populated New York, reporting their wettest years on record. Please see the U.S. annual report for detailed precipitation information. In October, two separate storm systems—a tropical depression from the Pacific and another system from the Caribbean—dumped nearly five feet (1520 mm) of rain in some areas across Central America from the 10th to the 20th. Honduras, Costa Rica, Guatemala, El Salvador, and Nicaragua were majorly impacted. Please see the October Global Hazards report for detailed precipitation information. In India, rainfall during the Southwest Monsoon season (June–September) was near normal, at one percent above the long-term average for the country as a whole. According to the India Meteorological Department, precipitation ranged from 14 percent below normal in the northeast of the country to 10 percent above normal in Central India. Conversely, Sindh Province in southern Pakistan had its wettest monsoon season on record, with three and a half times its average rainfall. Most of the rain fell in a four-week period from mid-August to early-September. The East Asian Monsoon brought heavy precipitation to South Korea in 2011. The country had its wettest summer on record, according to the World Meteorological Agency (WMO). On July 27th, the capital city of Seoul, South Korea experienced its heaviest single-day rainfall (11.8 inches; 300 mm) since 1907. Storms and heavy monsoon rains from late July to November contributed to the worst flooding in Thailand since 1942. Some areas were under six feet (two meters) of water. Other countries in Southeast Asia were affected by the heavy rainfall, including Cambodia, Myanmar, and Vietnam. Please see the November Global Hazards report for detailed precipitation information. The WMO reported that, in Europe, both France and the Netherlands each had their driest spring on record. The Netherlands followed with its wettest summer on record. Austria's precipitation was 15 percent
below the 1971–2000 average, making this the driest year since 2003.
Contributing to this dryness was November, which was Austria's all-time
driest month on record. In contrast, Norway reported its wettest year, with records dating back to 1900. According to Meteorologisk Institutt, on average, the country received 130 percent of average rainfall, breaking the previous record of 125 percent set in 1983. Annual precipitation varied greatly across the UK. The UK Met Office reported that Scotland had its wettest year on record, at 122.2 percent of average, while it was the second and third driest years on record for East Anglia and the Midlands, respectively.
Credit:NOAA National Climatic Data Center, State of the Climate: Global Analysis for Annual 2011, |