|
||||||||||||
|
|
|
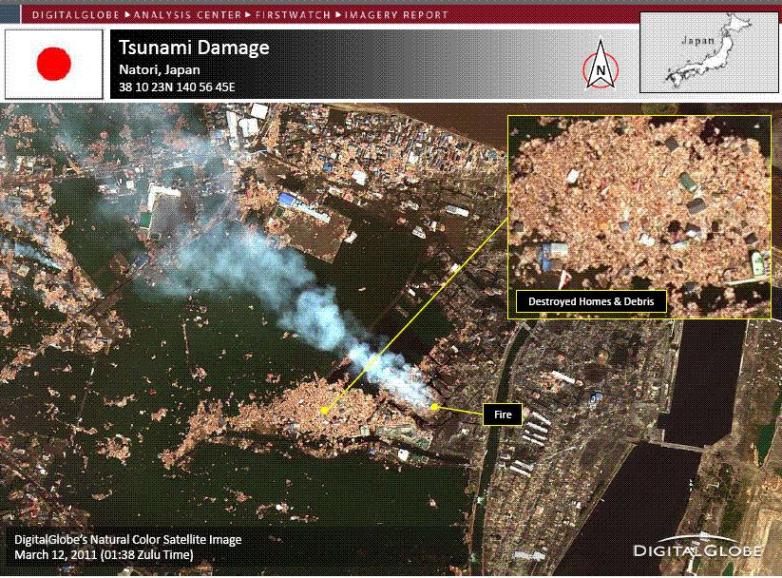
Earthquake and Tsunami hits Japan March 11, 2011
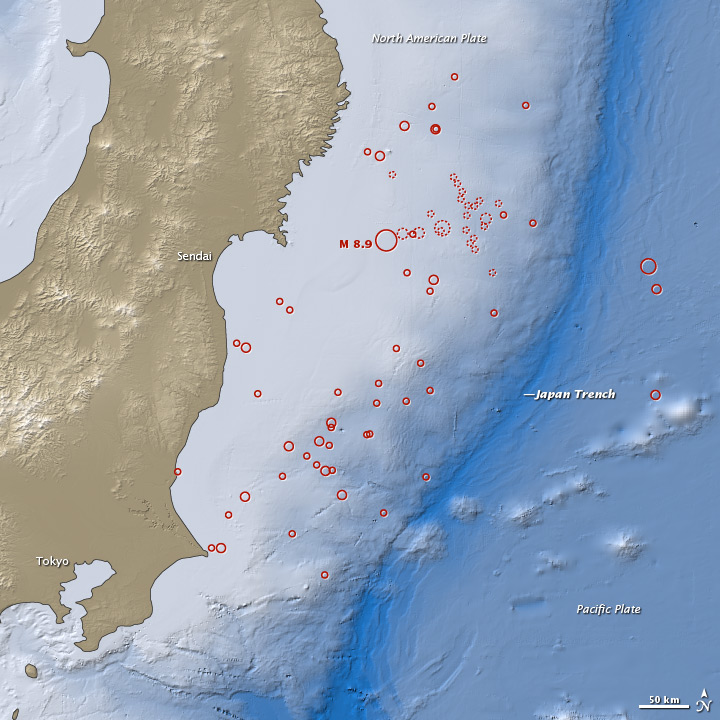
On March 11, 2011, at 2:46 p.m. local time (05:46 Universal Time, or UTC), a magnitude 8.9 earthquake struck off the east coast of Japan, at 38.3 degrees North latitude and 142.4 degrees East longitude. The epicenter was 130 kilometers (80 miles) east of Sendai, and 373 kilometers (231 miles) northeast of Tokyo. If initial measurements are confirmed, it will be the world’s fifth largest earthquake since 1900 and the worst in Japan’s history. The combined total of dead and missing amount to a potential death toll of 23,840. The USGS has updated the magnitude of the March 11, 2011, Tohoku earthquake in northern Honshu, Japan, to 9.0 from the previous estimate of 8.9. Independently, Japanese seismologists have also updated their estimate of the earthquake’s magnitude to 9.0. This magnitude places the earthquake as the fourth largest in the world since 1900 and the largest in Japan since modern instrumental recordings began 130 years ago. The USGS often updates an earthquake’s magnitude following the event. Updates occur as more data become available and more time-intensive analysis is performed. There are many methods of calculating the energy release and magnitude of an earthquake. Some methods give approximate values within minutes of the earthquake, and others require more complete data sets and extensive analysis. Due to inherent uncertainties in the modeling of energy and magnitude, the results from different agencies often vary slightly. These magnitude discrepancies arise from the use of different data and techniques.
The 03/11/2011 earthquake (preliminary magnitude 8.9) near the east coast of Honshu, Japan, occurred as a result of thrust faulting on or near the subduction zone interface plate boundary between the Pacific and North America plates. At the latitude of this earthquake, the Pacific plate moves approximately westwards with respect to the North America plate at a velocity of 83 mm/yr. The Pacific plate thrusts underneath Japan at the Japan Trench, and dips to the west beneath Eurasia.
The location,
depth, and focal mechanism of the March 11 earthquake are consistent with
the event having occurred as thrust faulting associated with subduction
along this plate boundary. Note that some authors divide this region into
several microplates that together define the relative motions between the
larger Pacific, North America and Eurasia plates; these include the
Okhotsk and Amur microplates that are respectively part of North America
and Eurasia.
The March 11
earthquake was preceded by a series of large foreshocks over the previous
two days, beginning on March 9th with an M 7.2 event approximately 40 km
from the March 11 earthquake, and continuing with a further 3 earthquakes
greater than M 6 on the same day. The Japan Trench subduction zone has hosted 9 events of magnitude 7 or greater since 1973. The largest of these was an M 7.8 earthquake approximately 260 km to the north of the March 11 event, in December 1994, which caused 3 fatalities and almost 700 injuries. In June of 1978, an M 7.7 earthquake 35 km to the southwest caused 22 fatalities and over 400 injuries.
Reporters came across the dogs whilst filming the destruction wreaked by Friday's earthquake and tsunami in Ibaraki Prefecture, northeast Japan. The pair were rescued by vets from Japan Earthquake Animal Rescue and Support. The tan and white spaniel was taken to a shelter in Mito while its injured mate is being treated by a vet in the same town.
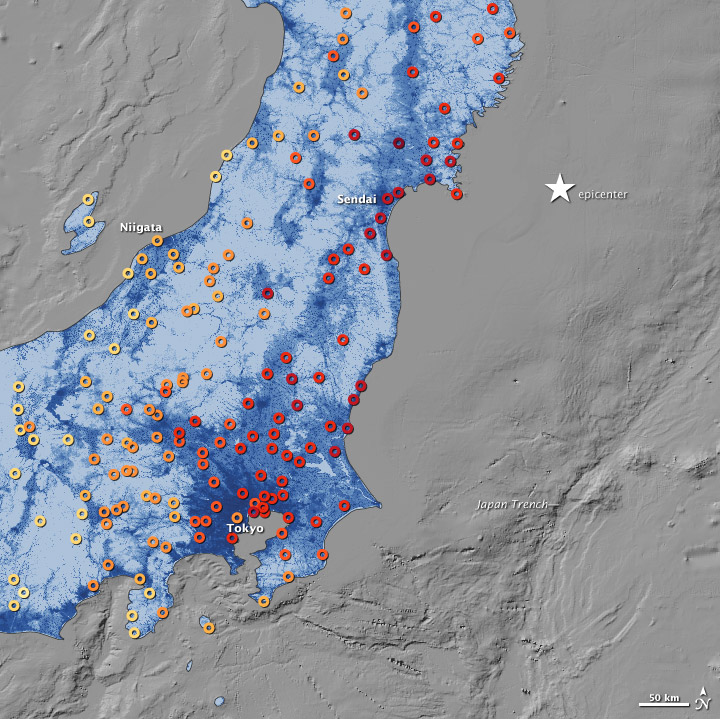
On March 11, 2011, the largest earthquake in Japan’s modern history struck off the northeast coast, about 130 kilometers (81 miles) east of the mainland region of Tohoku. Initially categorized as magnitude 8.9, the quake was later revised upward to magnitude 9.0 by the Japanese Meteorological Agency (JMA) and the U.S. Geological Survey (USGS). The event shook buildings and damaged infrastructure hundreds of kilometers away. Closer to the main shock, coastal regions were devastated by the quake and the resulting tsunami. This map shows the ground motion and shaking intensity from the earthquake at dozens of locations across Japan. Each circle represents an estimate of shaking as recorded by the USGS, in conjunction with regional seismic networks. Shades of pale yellow represent the lowest intensity and deep red represents high intensity. The ground shaking data is overlaid on a map of population density provided by Oak Ridge National Laboratory. A shaking intensity of VI is considered “strong” and can produce “light damage,” while a IX on the scale is described as “violent” and likely to produce “heavy damage.” The pattern of shaking appears to run parallel to the offshore subduction trench, with the intensity decreasing more from east to west, as opposed to north and south. Ground motion also seems to be more intense in coastal and riverine areas, where settlements are built on softer sediments and less bedrock. Note the number of VIIs and VIIIs near Tokyo, well away from the epicenter; the lack of a severe human toll in that metropolitan area is surely a testament to the quality of the nation’s earthquake preparedness. In the week after the main quake, Japan endured 262 aftershocks of at least magnitude 5, according to JMA. Forty-nine of them were magnitude 6 or greater, and three were magnitude 7 or higher. The aftershocks have been almost entirely offshore, in a zone stretching about 500 kilometers (300 miles) from Iwate to Ibaraki prefectures. NASA Earth Observatory Image by Jesse Allen and Robert Simmon, using data from the USGS Earthquakes Hazard Program and Oak Ridge National Laboratory Geograp
Credit: NOAA, Japan Meteorological Agency,NASA ,USGS, NHK, Russia Today |