|
||||||||||||
|
|
|
U.S. Energy Overview ANNUAL ENERGY OUTLOOK 2022
PETROLEUM AND NATURAL GAS REMAIN THE MOST-CONSUMED SOURCES OF ENERGY IN
THE UNITED STATES THROUGH 2050, BUT RENEWABLE ENERGY IS THE FASTEST
GROWING
·
Motor gasoline remains the most prevalent transportation fuel despite
electric vehicles gaining market share
·
Energy-related carbon dioxide (CO2)
emissions dip through 2035 before climbing later in the projection years
·
Energy consumption increases through 2050 as population and economic
growth outweighs efficiency gains
·
Electricity continues to be the fastest-growing energy source in
buildings, with renewables and natural gas providing most of the
incremental electricity supply
WIND AND SOLAR INCENTIVES, ALONG WITH FALLING TECHNOLOGY COSTS, SUPPORT
ROBUST COMPETITION WITH NATURAL GAS FOR ELECTRICITY GENERATION, WHILE THE
SHARES OF COAL AND NUCLEAR POWER DECREASE IN THE U.S. ELECTRICITY MIX
·
Electricity demand grows slowly across the projection period, which
increases competition among fuels
·
Renewable electricity generation increases more rapidly than overall
electricity demand through 2050
·
Battery storage complements growth in renewables generation and reduces
natural gas-fired and oil-fired generation during peak hours
·
As coal and nuclear generating capacity retire, new capacity additions
come largely from wind and solar technologies
U.S. CRUDE OIL PRODUCTION REACHES RECORD HIGHS, WHILE NATURAL GAS
PRODUCTION IS INCREASINGLY DRIVEN BY NATURAL GAS EXPORTS
·
U.S. production of natural gas and petroleum and other liquids rises amid
growing demand for exports and industrial uses
·
Driven by rising prices, U.S. crude oil production in the Reference case
returns to pre-pandemic levels in 2023 and stabilizes over the long term
·
Refinery closures lower domestic crude oil distillation operating
capacity, but refinery utilization rates remain flat over the long term
·
Consumption of renewable diesel increases as a share of the domestic fuel
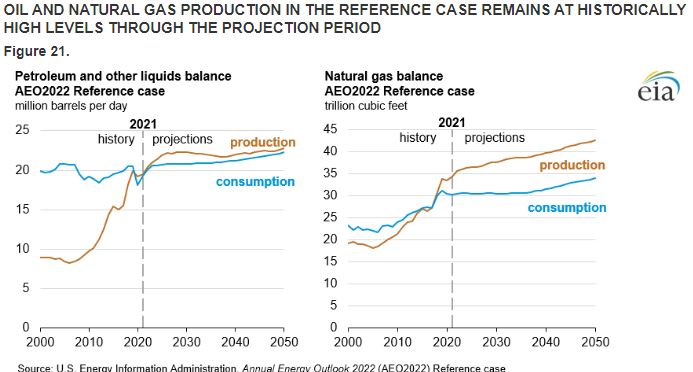
mix U.S. production of natural gas and petroleum and other liquids rises amid growing demand for exports and industrial usesOIL AND NATURAL GAS PRODUCTION IN THE REFERENCE CASE REMAINS AT HISTORICALLY HIGH LEVELS THROUGH THE PROJECTION PERIOD
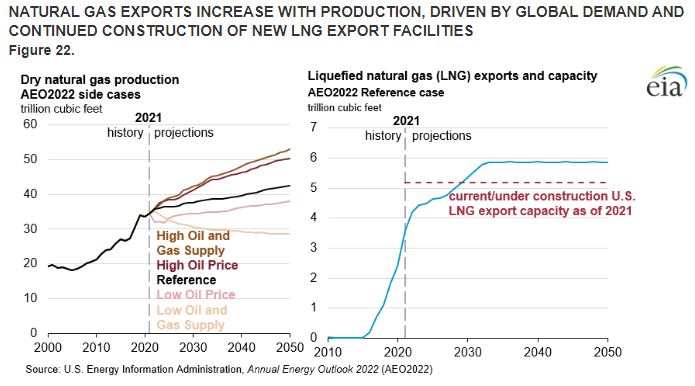
We project U.S. consumption and production of petroleum and other liquids to grow through 2050. Domestic consumption and production levels of petroleum and other liquids remain relatively close to one another through most of the projection period in the Reference case. Consumption increases by 15%, and production increases by 17% from 2021 to 2050. However, consumption and production of specific petroleum products vary. We also project consumption and production of natural gas to grow through 2050. During the projection period, natural gas production grows by almost 24%, approximately twice as fast as consumption. Much of this growth in natural gas production is exported as liquefied natural gas (LNG). By 2050, we project that approximately 25% more natural gas will be produced than consumed in the United States. Together, these Reference case trends highlight the continued growth in demand for U.S. natural gas and petroleum products.
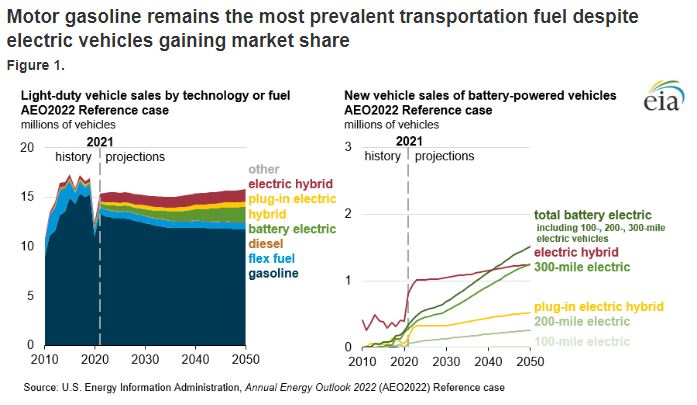
GASOLINE REMAINS THE DOMINANT LIGHT-DUTY VEHICLE (LDV) FUEL, BUT CONSUMPTION DOES NOT RETURN TO PRE-PANDEMIC LEVELS DURING THE PROJECTION PERIOD LDVs accounted for 54% of the energy consumed in U.S. transportation in 2021. Their share falls to 51% by 2050. LDV energy consumption generally decreases through 2038 and then increases through the end of the projection period. Total LDV sales do not return to 2019 pre-pandemic levels by 2050, and sales of conventional motor gasoline vehicles decrease through the projection period because of increasing sales of battery-electric vehicles (BEVs), hybrid-electric vehicles (HEVs), and plug-in hybrid-electric vehicles (PHEVs). We project that the combined share of sales of internal combustion engine (ICE) LDVs―including gasoline, diesel, flex-fuel, natural gas, and propane powertrains―will decrease from 92% in 2021 to 79% in 2050 because of growth in sales of BEVs, PHEVs, and HEVs. Through the projection period, 200- and 300-mile BEV sales grow, increasing from 0.34 million in 2021 to 1.52 million in 2050, while sales of PHEVs increase from 144,000 in 2021 to 521,000 in 2050. PHEVs demonstrate fast growth and market penetration between 2021 and 2024. Growth in PHEV sales slows after 2024 as a result of declining battery prices, which pushes BEVs into the highest electric LDV market share. We project BEVs and PHEVs combined account for 13% of total LDV sales in 2050. THE ON-ROAD VEHICLE STOCK SHIFTS MORE SLOWLY THAN SALES BECAUSE ELECTRIC VEHICLES REPLACE OLDER, RETIRED ICE VEHICLES We project that the total electric vehicle share―including BEVs and PHEVs―of on-road LDV stock grows from less than 3% in 2021 to 13% in 2050, based on current laws and regulations as of November 2021. This shift occurs even as the on-road LDV stock likely grows from 260 million to 288 million vehicles over that timeframe. Increased electrification of the on-road LDV fleet increases electricity consumption from less than 0.5% to more than 2% of total consumption of energy in the transportation sector between 2019 and 2050 in the Reference case.
The three-year rolling average growth rate of electricity consumption in the United States peaks in 2023 as the economy returns to pre-pandemic levels of economic activity. In the short term, demand for electricity may fluctuate as a result of year-to-year weather, economic shocks, or other unpredictable events. Economic growth drives longer-term trends in electricity consumption, although the growth is somewhat offset by efficiency improvements. In the Reference case, the average annual growth rate of electricity consumption surpasses 1% but not until near the end of the projection period. Electricity demand in the AEO2022 High Economic Growth case grows about 0.25% faster than in the Reference case, and it grows about 0.25% slower in the Low Economic Growth case. ELECTRICITY DEMAND IN TRANSPORTATION REMAINS LOW We project that demand for electricity grows fastest in the transportation sector, even as consumption in that sector remains less than 3% of economy-wide electricity consumption in the Reference case. Fully electric vehicles grow from less than 1% of the on-road LDV fleet in 2021 to a little over 7% in 2050 in the Reference case. The increase in demand primarily follows evolutionary electric vehicle (EV) technology and market developments, as well as current fuel economy regulations. Both vehicle sales and utilization (miles driven) would need to increase substantially for EVs to raise electric power demand growth rates by more than a fraction of a percentage point per year. The transportation sector’s share of electricity consumption is greatest in the High Oil Price case, where it reaches 5% of the total in 2050.
Credit EIA |