|
||||||||||||
|
|
Arctic Sea Ice 2011
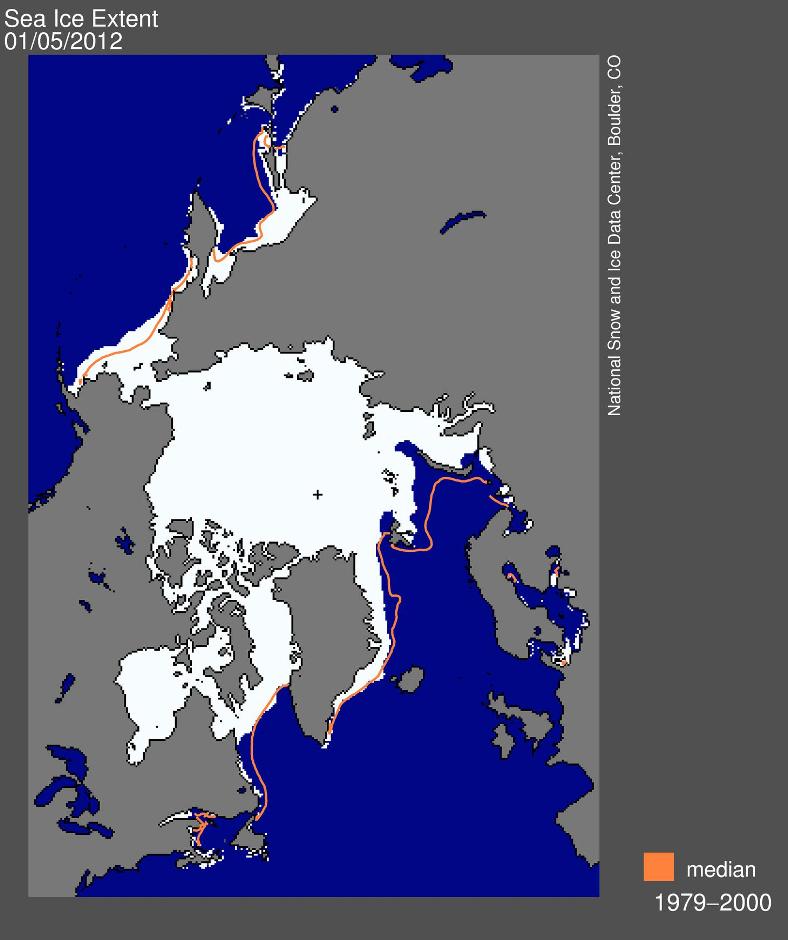
Arctic sea ice extent in December 2011 averaged 12.38 million square kilometers (4.78 million square miles). This is the third lowest December ice extent in the 1979 to 2011 satellite data record, 970,000 square kilometers (375,000 square miles) below the 1979 to 2000 average extent. Ice extent was particularly low on the Atlantic side of the Arctic, most notably in the Barents and Kara seas. The eastern coast of Hudson Bay did not freeze entirely until late in the month: normally, Hudson Bay has completely frozen over by the beginning of December. In the Bering Sea, ice extent was slightly above average.
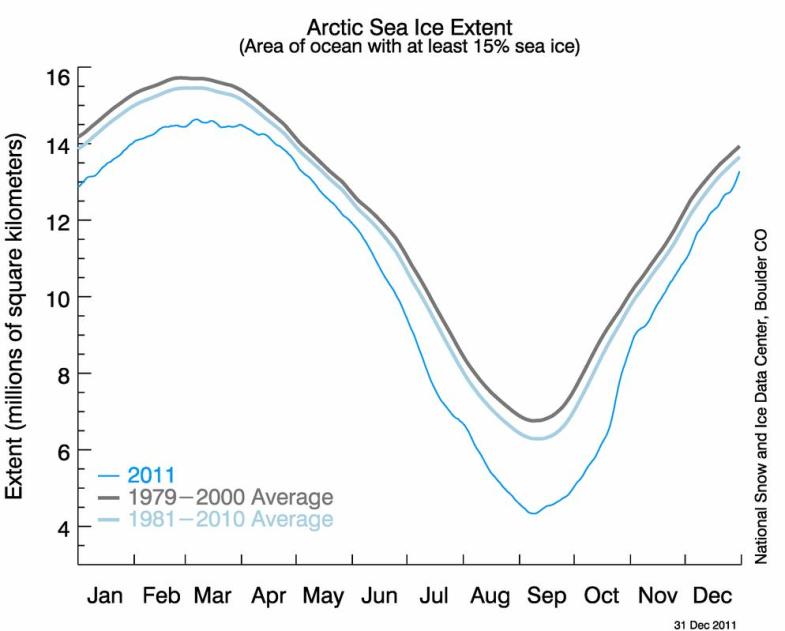
This full-year graph puts 2011 sea ice extent in context. The gray line shows the 1979 to 2000 climatology, thick blue-gray indicates the 1981 to 2010 (30-year) climatology. NOAA this year switched to using the period 1981 to 2010 for their thirty-year climate comparison period. The minimum Arctic sea ice extent occurs in September. The maximum is in late February or early March.
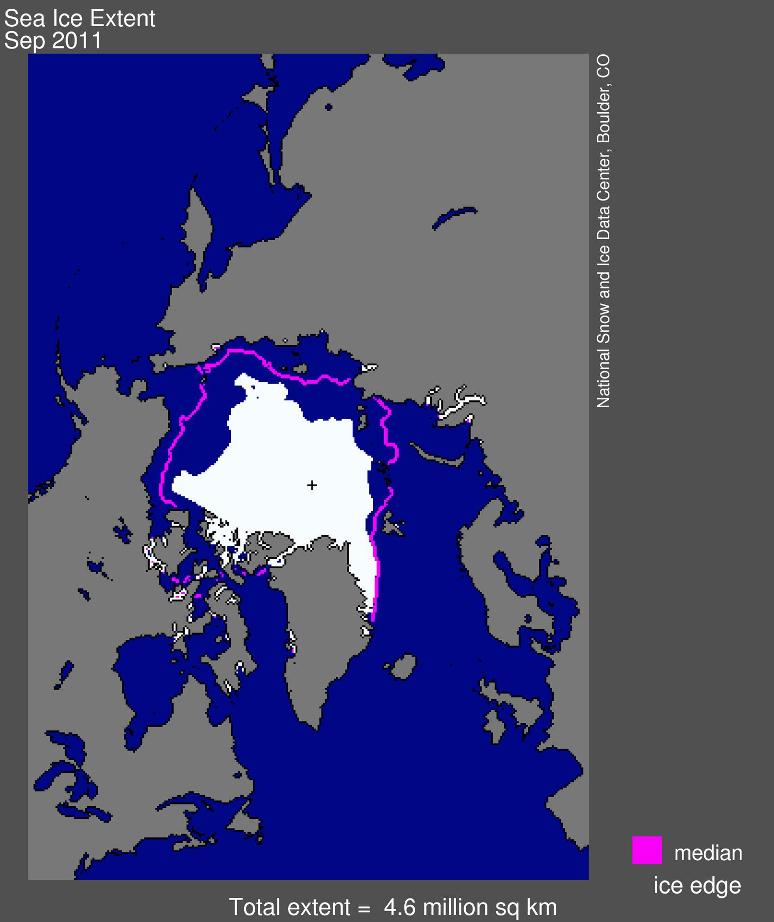
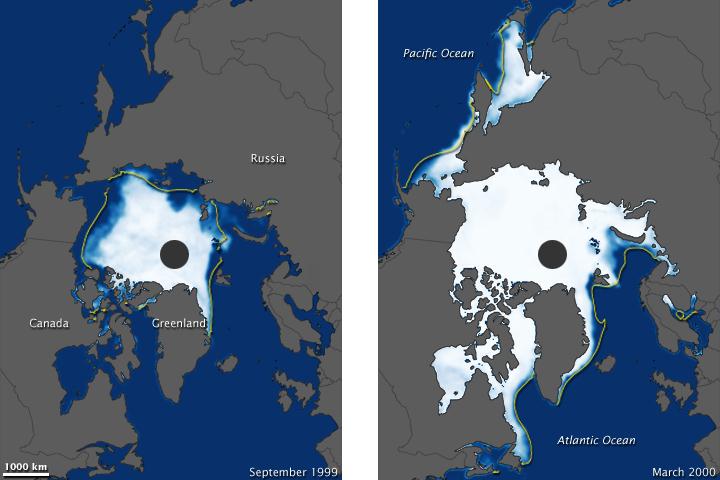
Arctic sea ice extent for September 2011 was 4.61 million square kilometers (1.78 million square miles). The magenta line shows the 1979 to 2000 median extent for that month. The black cross indicates the geographic North Pole
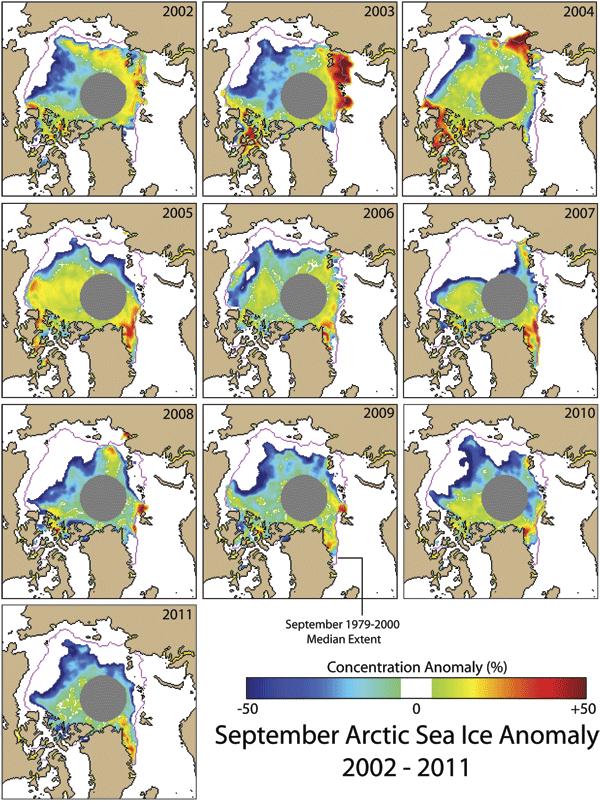
Extent anomaly maps, 2002-2011: Sea ice conditions for the month of September, 2002 through 2011, derived from the NSIDC Sea Ice Index. Each image shows the concentration anomaly (see color key) and the 1979-2000 mean September ice edge (pink line). Nearly every year, the ice edge is well north of its mean position off the coasts of Alaska and Siberia. Image provided by National Snow and Ice Data Center, University of Colorado, Boulder. March 2, 2011February Arctic ice extent ties 2005 for record low; extensive snow cover persistsArctic sea ice extent for February 2011 tied with February 2005 as the lowest recorded in the satellite record. Sea ice extent was particularly low in the Labrador Sea and Gulf of St. Lawrence. In contrast, winter snow cover remained extensive in many parts of the Northern Hemisphere.
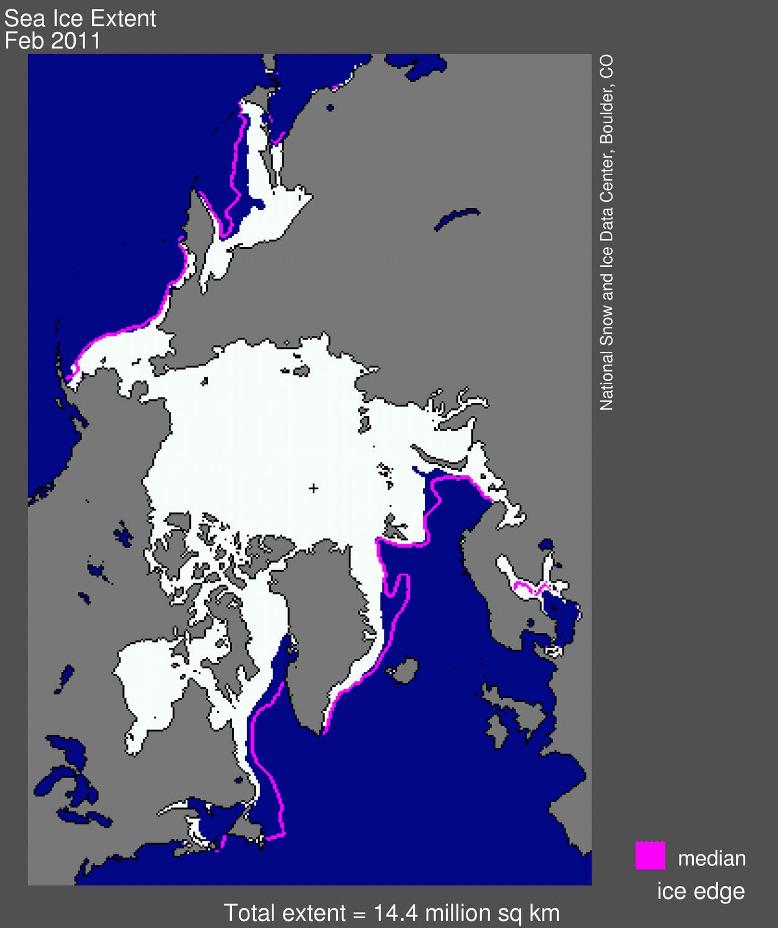
Sea ice extent averaged over the month of February 2011 was 14.36 million square kilometers (5.54 million square miles). This was a tie with the previous record low for the month, set in 2005. February ice extent remained below normal in both the Atlantic and Pacific sectors, particularly in the Labrador Sea and the Gulf of St. Lawrence. While ice extent has declined less in winter months than in summer, the downward winter trend is clear. The 1979 to 2000 average is 15.64 million square kilometers (6.04 million square miles). From 1979 through 2003, the February extent averaged 15.60 million square kilometers (6.02 million square miles). Every year since 2004 has had a mean February extent below 15 million square kilometers (5.79 million square miles).
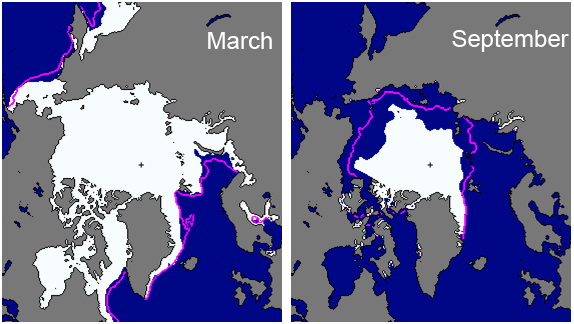
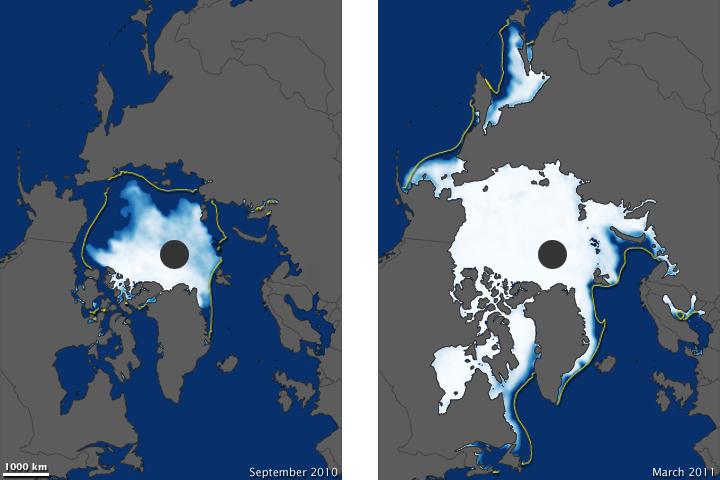
Sea ice extent in March 2011 (left) and September 2011 (right), illustrating the respective monthly winter maximum and summer minimum extents. The magenta line indicates the median maximum and minimum ice extents in the given month for the period 1979-2000
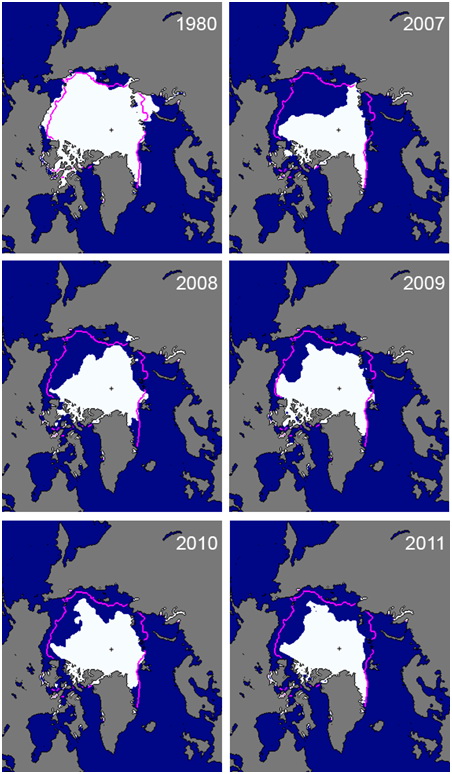
Maps of September ice extent for 1980, 2007, 2008, 2009, 2010 and 2011. The magenta line indicates the median September ice extent for the period 1979-2000.
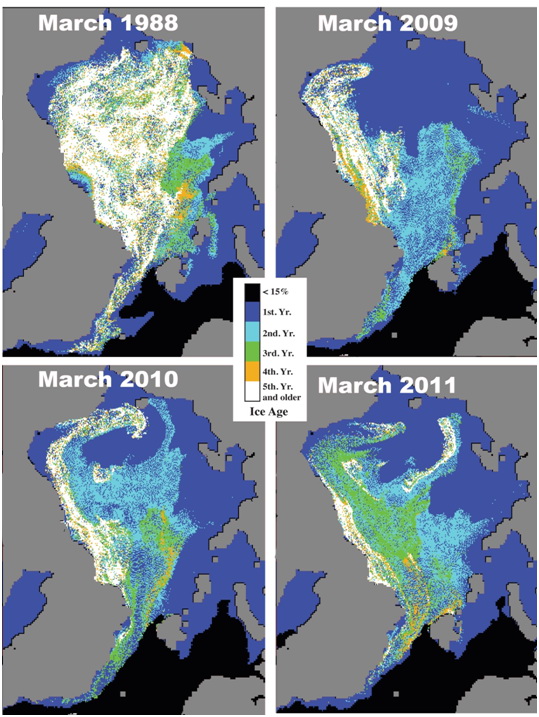
Sea ice age in the first week of March derived from tracking the drift of ice floes in 1988, 2009, 2010 and 2011. Figure courtesy of J. Maslanik and C. Fowler.
,NSIDC |