|
||||||||||||
|
|
Arctic Sea Ice 2012
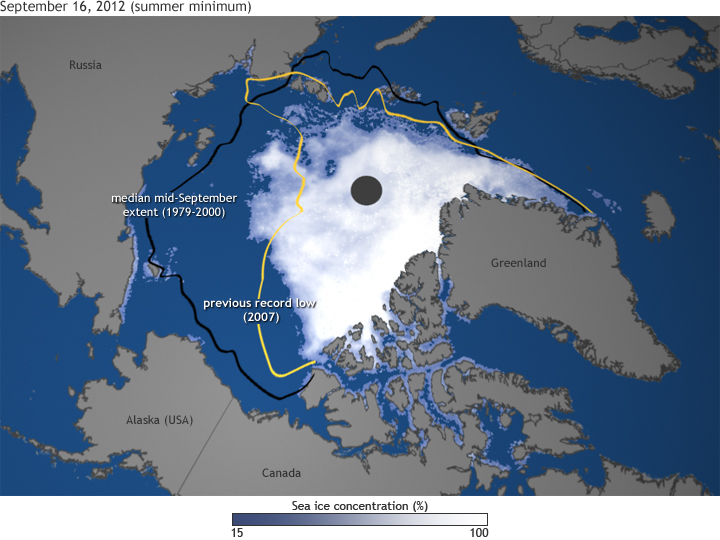
Map by Dan Pisut, NOAA Environmental Visualization Lab, based on sea ice concentration data from the National Snow and Ice Data Center. Caption by Rebecca Lindsey. Reviewed by Mark Serreze, National Snow and Ice Data Center. Highlights
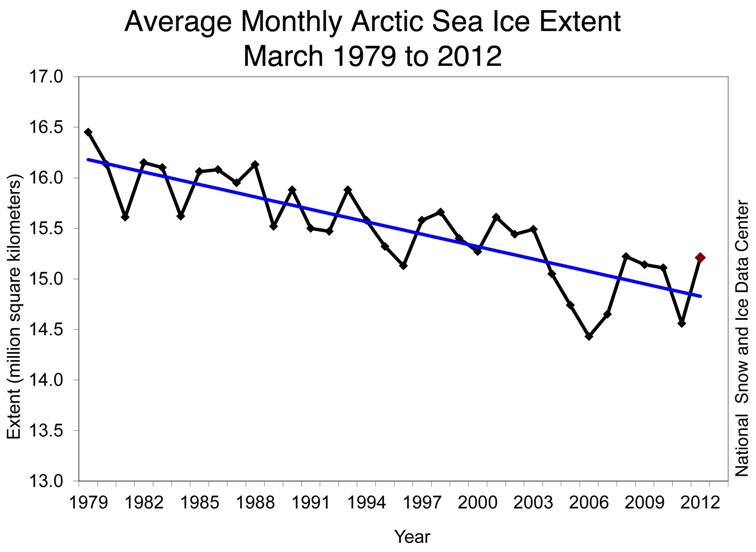
On August 26, 2012, Arctic sea ice extent shrank to 1.58 million square miles (4.1 million square kilometers), an area about half the size of the Lower 48 United States. That ice was melting was not news; after all, the Arctic ice pack undergoes an annual cycle of winter expansion and summer melting. The “news” was that the extent had broken the previous record low, set in summer 2007, and there were still several more weeks to go in the melt season. By the time the summer melt season came to an end in mid-September, the ice extent had shrunk down to just 1.3 million square miles (3.41 square kilometers), setting a new record low that was 18 percent smaller than the previous record and nearly 50 percent smaller than the long-term (1979-2000) average. This map shows ice concentration on September 16, along with the extent of the previous record low (yellow line) and the mid-September median extent (black line). It can be hard to imagine how radical a transformation the loss of so much ice is. Most of us live in a world where snow and ice are transient things, momentarily hiding the “real” landscape. In the Arctic, ice is the real landscape, and for it to have shrunk to half its historic summer extent is as much a transformation of the environment as if half the forests of New England had been replaced by Saguaro cactus. The transformation from icy to ice-free has ecological consequences and physical ones. The loss of sea ice directly affects polar bears, seals, walruses, and many birds, for which the sea ice is a raft, a place to haul out, rest, feed, and give birth. The “where, when, and what kind” of blooms of phytoplankton—the foundation of the marine food web—is changing, and those changes cascade through fish populations. The most profound physical impact ice loss is that the loss becomes a sort of “self-fulfilling prophecy.” Less ice turns Arctic latitudes from a bright white solar reflector into a dark expanse of open water: a black t-shirt on a summer day. The more ice that melts, the more sunlight the ocean absorbs. The more sunlight the ocean absorbs, the warmer it gets, and the more ice melts. That self-reinforcing feedback loop is the heart of the process that scientists refer to as “Arctic amplification” of global warming, and it explains why temperatures have risen faster in the Arctic than they have at temperate latitudes. Sea ice extentSea ice extent is used to describe the state of the Arctic sea ice cover. There is an accurate record of extent since 1979, determined from satellite-based passive microwave instruments. There are two months each year that are of particular interest: September, at the end of summer, when the ice reaches its annual minimum extent, and March, at the end of winter, when the ice is at its maximum extent.
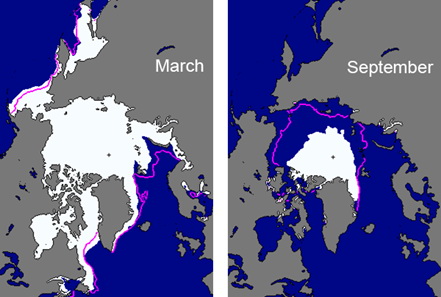
Sea ice extent in March 2012 (left) and September 2012 (right), illustrating the respective monthly averages during the winter maximum and summer minimum extents. The magenta line indicates the median maximum and minimum ice extents in March and September, respectively, during the period 1979-2000. Maps are from the National Snow and Ice Data Center Sea Ice
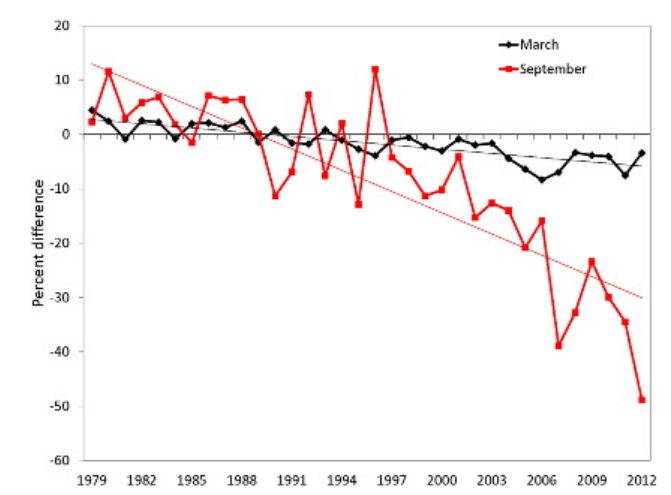
Time series of ice extent anomalies in March (the month of ice extent maximum) and September (the month of ice extent minimum). The anomaly value for each year is the difference (in %) in ice extent relative to the mean values for the period 1979-2000. The thin black and red lines are least squares linear regression lines with slopes indicating ice losses of -2.6% and -13.0% per decade in March and September, respectively. Based on estimates produced by the National Snow and Ice Data Center, on September 16, 2012 the sea ice cover reached its minimum extent for the year of 3.41 million km2. This was the lowest in the satellite record; 18% lower than in 2007, when the previous record of 4.17 million km2 was recorded . Overall, this year's minimum was 3.29 million km2 (49%) below the 1979-2000 average minimum of 6.71 million km2. The last six years, 2007-2012, have the six lowest minimum extents since satellite observations began in 1979. In March 2012 ice extent reached a maximum value of 15.24 million km2 , 4% below the 1979-2000 average. This was the highest maximum in 9 years, but 2004-2012 has the nine lowest maximum extents since 1979. The relatively high maximum extent in March 2012 was due to conditions in the Bering Sea, where ice extent was at or near record levels throughout the winter and spring. After reaching maximum extent, the seasonal decline began slowly, particularly in the Bering Sea, and around mid-April, extent was close to the 1979-2000 average for the time of year. However, soon after that the decline accelerated and was faster than normal through much of the summer. August 2012 was a period of particularly rapid ice loss, in part due to a storm that passed through the region at the beginning of the month . Overall, 11.83 million km2 of ice was lost between the maximum and minimum extents. This is the largest seasonal decline in the record and 1 million km2 more than in any previous year. Sea ice extent is decreasing in all months and virtually all regions (the exception being the Bering Sea during winter). The September monthly average trend is now -91,600 km2 per year, or -13.0 % per decade relative to the 1979-2000 average (Fig. 2.2). The magnitude of the trend has increased every year since 2001. Trends are smaller during March, but still decreasing and statistically significant. The March trend is -2.6% per decade . Average ice extents for each month are presented this graph
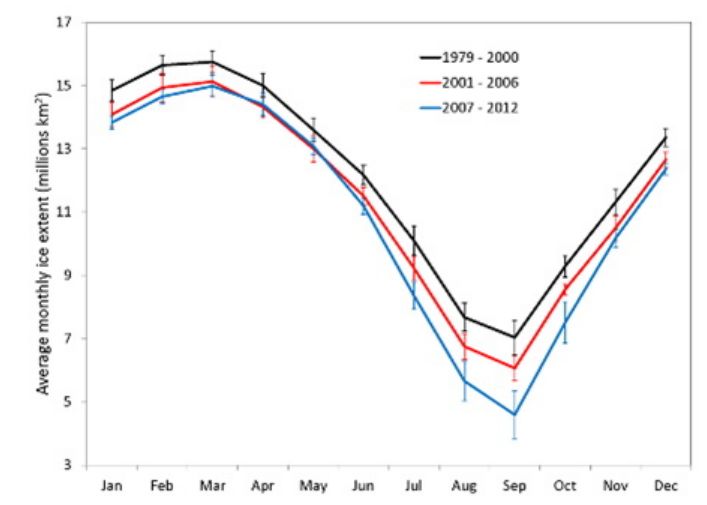
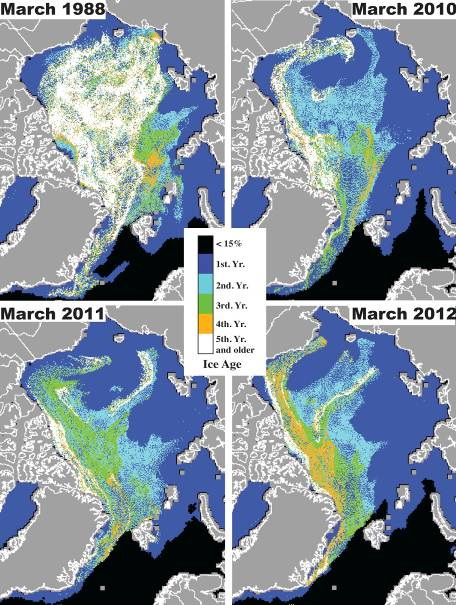
Mean monthly sea ice extent for the reference period 1979-2000 (thick black line) and for the 2001-2006 (red line) and 2007-2012 (blue line). The vertical bars represent one standard deviation about the mean value for each month. Three time periods are compared; the reference period 1979-2000, 2001 to 2006, and the last six years (2007-2012) beginning with the previous record minimum of 2007. The 1979-2000 period has the largest ice extent for every month, with the greatest difference between the time periods occurring in September. Comparing the two 21st Century periods shows that ice extent is similar in winter and spring, but summer values are significantly lower in 2007-2012. Spatial distribution of sea iceIn 2007 persistent winds through the summer, created by an Arctic dipole circulation pattern , resulted in a compact ice cover and an ice edge far to the north on the Pacific side of the Arctic. However, the circulation also pushed ice onto the coast in the Laptev Sea, completely blocking the Northern Sea Route. In the years since 2007, the pattern of ice loss has varied, but a tongue of older ice in the East Siberian Sea has persisted through the summer. This tongue was particularly evident in 2010 and 2011. In 2012 that tongue of ice mostly melted away, aided by the August storm, and ice retreated significantly around the entire perimeter of the ice pack This includes the Atlantic side, north of Svalbard, where extents had been near normal in recent years. Overall, compared to 2007 there was more ice this year in the central Arctic north of the Bering Strait, but less ice nearly everywhere else. Age of the iceThe age of the ice is another key descriptor of the state of the sea ice cover. Older ice tends to be thicker and thus more resilient to changes in atmospheric and oceanic forcing than younger ice. The age of the ice is determined using satellite observations and drifting buoy records to track ice parcels over several years (Tschudi et al., 2010). This method has been used to provide a record of ice age since the early 1980s . The distribution of ice of different ages illustrates the extensive loss in recent years of the older ice types (Maslanik et al., 2011). Analysis of the time series of areal coverage by age category indicates the continued recent loss of the oldest ice types, which accelerated starting in 2005 (Maslanik et al., 2011). For the month of March, older ice (4 years and older) has decreased from 26% of the ice cover in 1988 to 19% in 2005 and to 7% in 2012. This represents a loss of 1.71 million km2 since 2005. In March 1988, 58% of the ice pack was composed of first-year ice (ice that has not survived a melt season). In March 2012, first-year ice dominated the pack (75%). Younger ice is typically thinner than older ice (e.g., Maslanik et al., 2007), so the current ice pack is likely thinner on average than it was in 1988. Note that, from March 2011 to March 2012, much of the three-year-old ice north of the Canadian Archipelago survived the melt season, resulting in an increase in four-year-old ice in March 2012 (5%, compared to 2% in March 2011). This increase was directly associated with a reduction in the fraction of three-year-old ice, which decreased from 9 to 7%.
Sea ice age in the first week of March 1988, 2010, 2011 and 2012, determined using satellite observations and drifting buoy records to track the movement of ice floes. Figure courtesy of J. Maslanik and M. Tschudi.
Visualizing the 2012 Sea Ice MinimumSeptember 27, 2012
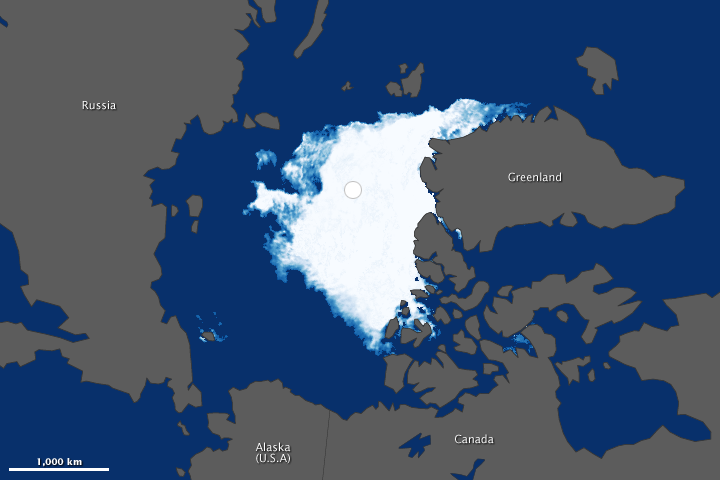
acquired September 13, 2012
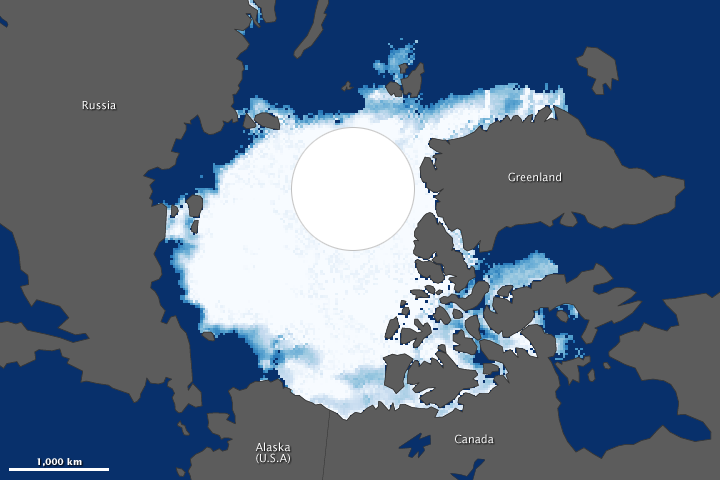
acquired September 14, 1984
In August and September 2012, sea ice covered less of the Arctic Ocean than at any other time since at least 1979, when the first reliable satellite measurements began. The National Snow and Ice Data Center (NSIDC) and NASA announced in mid-September that the extent of Arctic sea ice had dropped to 3.41 million square kilometers (1.32 million square miles)—well below the previous record of 4.17 million square kilometers (1.61 million square miles) set in 2007. The maps above compare the Arctic ice minimum extents from 2012 (top) and 1984 (bottom). According to NSIDC, the average minimum extent for 1979–2000 was 6.70 million square kilometers (2.59 million square miles). The 1984 minimum was roughly that amount, so a comparison between 2012 and 1984 gives an idea of how much conditions this year strayed from the long-term average. The minimum ice extent in 2012 was about half the average. (Turn on the image-comparison tool to see the difference.) Arctic sea ice grows through the winter each year and melts through the summer, typically reaching its minimum extent sometime in September. The extent can vary considerably from year to year, sometimes above the long-term average and sometimes below. Extent is defined as the total area in which the ice concentration is at least 15 percent. The 2012 map was compiled from observations by the Advanced Microwave Scanning Radiometer 2 (AMSR-2) sensor on the Global Change Observation Mission 1st–Water (“Shizuku”) satellite, which is operated by the Japan Aerospace Exploration Agency (JAXA). As of September, AMSR-2 data were still preliminary, as the mission was launched in May 2012 and instruments are still being fully calibrated and validated. But the data agreed with observations from the Special Sensor Microwave Imager/Sounder (SSMIS) from the U.S. Defense Meteorological Satellite Program. The 1984 image was made from observations by the Scanning Multichannel Microwave Radiometer (SMMR) on the Nimbus-7 satellite. Sea ice in the 1984 image has a blockier appearance because that sensor had coarser resolution. The white circle over the pole in each image is a data gap resulting from satellites flying close to—but not directly over—the poles. The wider orbital coverage by AMSR-2 (and other satellite instruments) has shrunk the size of this gap. The area around the North Pole is ice-covered—an assumption confirmed by many airborne and ice-surface expeditions—but researchers use an average of the concentration just outside the gap to estimate the extent within. The summer of 2012 witnessed periods of extremely rapid sea ice melt. “In June, sea ice lost about 170,000 to 175,000 square kilometers per day, but only for a few days,” NSIDC scientist Walt Meier explained. “Sea ice melt usually slows down in August to about 60,000 to 70,000 square kilometers a day. But this year, we saw melt rates upwards of 100,000 to 150,000 square kilometers a day, and those high melt rates persisted through the first half of the month.” Once sea ice begins to melt, it becomes a self-reinforcing process. Because there is less ice to reflect sunlight back into space, more energy is absorbed by the darker ocean water. As sea ice extents drop, less ice survives from year to year. Ice that has formed since the last melt season—“known as first-year ice”—is thinner and more prone to melting than thicker multi-year ice. In the past decade, first-year ice has come to dominate the Arctic Ocean. According to Comiso, the rapid loss of sea ice through June 2012 was likely associated with the loss of this first-year ice, which was unusually extensive in March 2012. The rapid decline in August 2012, he noted, was caused in part by a strong storm that stirred up the region, breaking ice apart and moving more of it to lower latitudes. “Climate models have predicted
a retreat of the Arctic sea ice; but the actual retreat has proven to be much
more rapid than the predictions,” said Claire Parkinson, a climate researcher
at NASA Goddard. “There continues to be considerable inter-annual variability
in the sea ice cover, but the long-term retreat is quite apparent.” AMSR-2 is a follow-on to the successful AMSR-E instrument, a JAXA instrument that flew on NASA’s Aqua satellite. AMSR-2 detects microwave radiation in order to measure sea surface temperatures and wind speeds, sea ice concentrations, snow depth, soil moisture, water vapor, cloud liquid water, and precipitation. The AMSR-2 image is provided as a visual assessment of the state of sea ice through a special data access agreement with JAXA and with the principal investigator for sea ice, Josefino Comiso of NASA’s Goddard Space Flight Center. NASA Earth Observatory image by Jesse Allen, using data from the Advanced Microwave Scanning Radiometer 2 AMSR-2 sensor on the Global Change Observation Mission 1st-Water (GCOM-W1) satellite. Caption by Michon Scott and Mike Carlowicz.
,NSIDC. D. Perovich, W. Meier, M. Tschudi, S. Gerland, J. Richter-Menge ERDC - CRREL, 72 Lyme Road, Hanover, NH, USA Thayer School of Engineering, Dartmouth College, Hanover, NH, USA 3National Snow and Ice Data Center, University of Colorado, Boulder, CO, USA 4erospace Engineering Sciences, University of Colorado, Boulder, CO, USA 5Norwegian Polar Institute, Fram Centre,Tromsø Norway |